
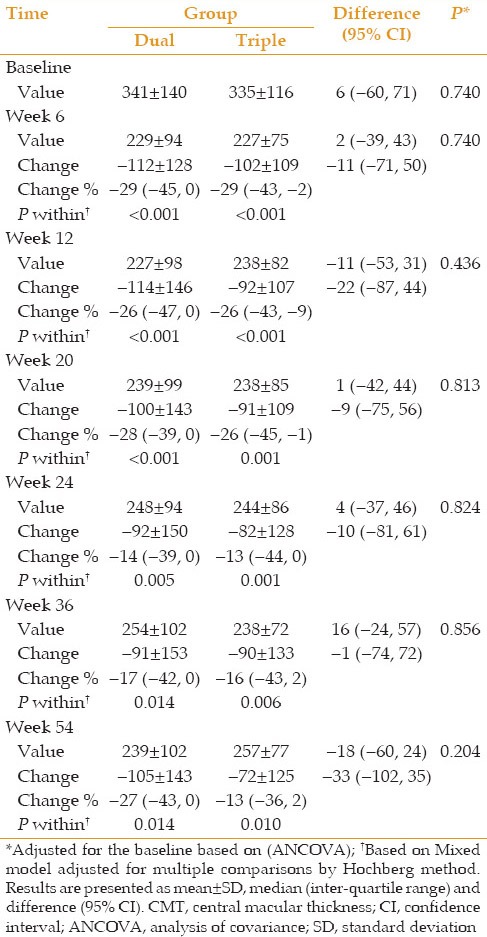
Table 3.
CMT values and changes compared to baseline and percentage of changes at different time points according to treatment groups (dual vs. triple)
Official websites use .gov
A
.gov website belongs to an official
government organization in the United States.
Secure .gov websites use HTTPS
A lock (
) or https:// means you've safely
connected to the .gov website. Share sensitive
information only on official, secure websites.
CMT values and changes compared to baseline and percentage of changes at different time points according to treatment groups (dual vs. triple)