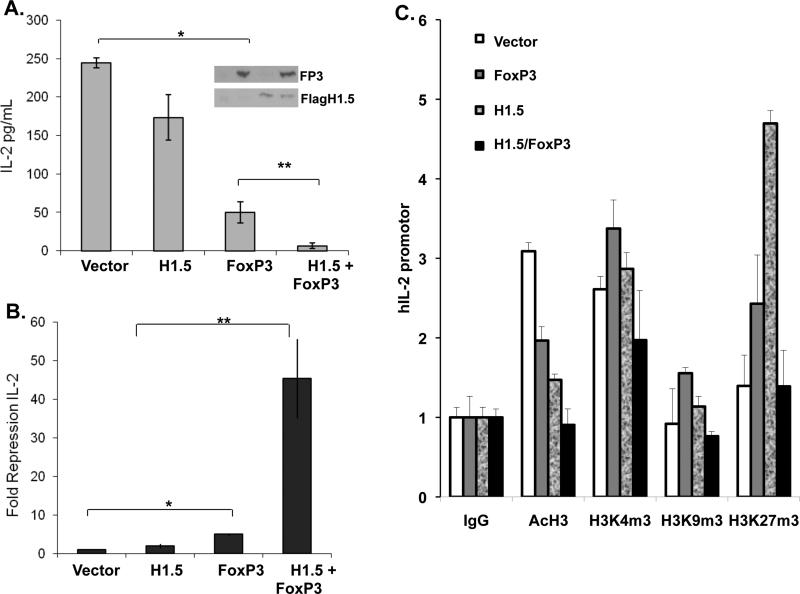
FIGURE 3. FoxP3 and H1.5 interact functionally to repress IL2 gene expression in T cells.
(A-B) FoxP3 and H1.5 cooperate to synergistically repress IL-2 expression in human T cells. (A) Jurkat T cells stably expressing flag-H1.5 were re-transduced with control vector or FoxP3-expressing vector (>95% with each or both vectors). Inset shows Western blot of FoxP3 and flagH1.5 expression. Transduced cells were stimulated with PMA and Ionomycin, and IL-2 expression was measured by IL-2 ELISA in culture supernatants in triplicates. Shown are IL2 levels normalized to total live cell numbers in each sample. Error bars indicate standard deviation. (B) Summary of relative repression of IL-2 from four independent experiments. Error bars indicate standard error, p-values are determined by two-tailed students’ t-test. *, p<0.05, **, P<0.005. (C) ChIP assays were performed to assess histone modifications (Acetylation of H3/H4, tri-methylation of H3 K4, K9 and K27) at the IL2 promoter. Results are quantified by real-time PCR and normalized to binding by control IgG antibody. Error bars indicate standard deviation. * = p<0.05.

