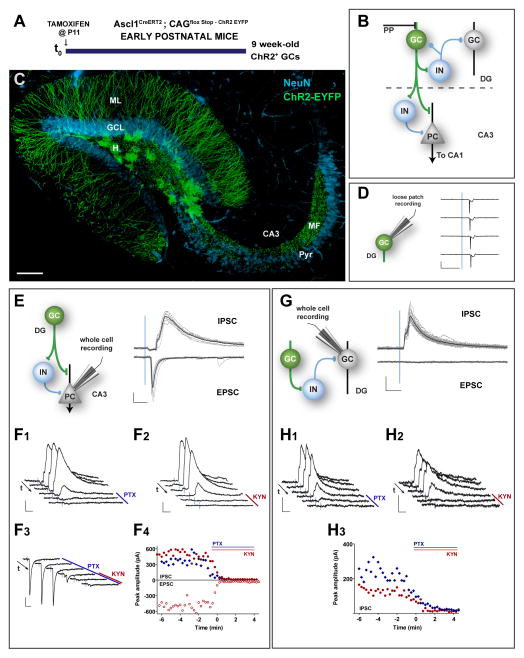
Figure 1. Dentate and CA3 networks recruited by GCs generated during development.
(A) Experimental design. Ascl1CreERT2;CAGfloxStopChR2 mice received TAM injections at P11 to induce indelible expression of ChR2 in neural progenitor cells and were sacrificed 9 weeks later to perform electrophysiological recordings in acute slices. See also Figure S1B. (B) Simplified diagram of the local dentate networks. ChR2-GCs (green) contact multiple hilar interneurons (IN), CA3 pyramidal cells (PC), and CA3 IN. PP: Perforant path axons. (C) Confocal image of a 400-μm thick hippocampal section depicting 9 week-old GCs (green) generated at P11. NeuN immunofluorescence (blue) allows visualizing the GCL and CA3 pyramidal layer (pyr). Dendrites extend through the molecular layer (ML); mossy fibers (MF) project through the hilus (H) and to CA3 through the stratum lucidum. Scale: 100 μm. (D) Loose patch recordings in ChR2-GCs show reliable spiking evoked by a 1-ms laser pulse (denoted by the blue line). Representative data from N = 6 GCs. (E) Example whole-cell voltage clamp recordings in a PC. Left: Simplified scheme depicting light-activated pathways. Right: Brief (1 ms) light pulses delivered at low frequency (0.07 Hz) elicit inhibitory postsynaptic currents (IPSCs, recorded at 0 mV, upper traces) and excitatory postsynaptic currents (EPSCs, recorded at −70 mV, lower traces), recorded in the same neuron. Traces depict all sweeps in the experiment (gray) and their average (black). All cells showed light-evoked PSCs, with IPSC charge = 5.3 ± 2.0 pC, and EPSC charge = 1.9 ± 1.1 pC (N = 5 IPSC, N = 4 EPSC). (F1–F4) Pharmacological blockade of light-evoked PSCs. Example subsequent traces show IPSCs blockade after bath application of PTX (100 μM, F1) or KYN (6 mM, F2), consistent with a disynaptic FFI response. EPSCs are blocked by KYN (F3). Arrows indicate time flow, and bars denote antagonist application. (F4) Time course of EPSC and IPSC peak amplitude obtained from experiments shown in (F1–F3). Drug application for each case is indicated by the colored bars. (G) Voltage clamp recordings in mature (unlabeled) GCs. Left: Simplified scheme depicting light-activated pathways. Right: Single laser pulses (0.07 Hz) elicited IPSCs (upper traces, 100 % of trials) but not EPSCs (0 % of trials), with IPSC charge = 1.7 ± 0.9 pC, N = 8 GCs. (H1–H3) Pharmacological blockade of PSCs. Example subsequent traces show IPSCs blockade by PTX (100 μM, H1) or KYN (6 mM, H2), consistent with a disynaptic feedback response. (H3) Time course of IPSC peak amplitude obtained from experiments shown in (H1, H2). Scale bars: 20 ms, 100 pA.

