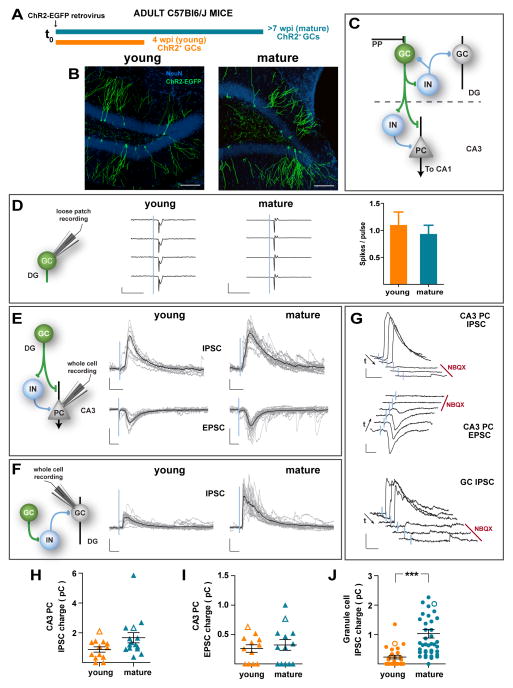
Figure 2. Distinct local networks recruited by immature vs. mature adult-born GCs.
(A) Experimental design. A retrovirus encoding for ChR2-EGFP was delivered to the DG of young adult mice. Acute slices were obtained 4 (orange) or 7 (blue) weeks later for electrophysiological recordings. (B) Confocal images displaying adult-born young and mature ChR2-GCs (green). NeuN (blue) allows visualization of the GCL. Calibration bar: 100 μm. (C) Simplified diagram of the local dentate networks. ChR2-GCs (green) contact multiple hilar interneurons (IN), CA3 pyramidal cells (PC), and CA3 IN. PP: Perforant path axons. (D) Left: Loose patch recordings in ChR2-GCs show similar reliability in laser (1 ms, blue line) – induced spiking in young and mature GCs. Scales: 50 pA (young), 200 pA (mature), 10 ms. Right: Spiking reliability for young and mature ChR2-GCs (N = 7 young, N = 12 mature, p = 0.76). (E) Example whole-cell voltage clamp recordings in a PC. Left: Simplified scheme depicting light-activated pathways. Right: Single laser pulses (1 ms, 0.07 Hz) delivered to young and mature ChR2-GCs elicit IPSCs (recorded at 0 mV, upper traces) and EPSCs (recorded at −70 mV, lower traces). Traces depict all sweeps in the experiment (gray) and their average (black). Scales: 50 pA, 20 ms (EPSCs) and 40 ms (IPSCs). (F) Example voltage clamp recordings in mature (unlabeled) GCs. Left: Simplified pathway scheme. Right: laser pulses elicited IPSCs but not EPSCs (out of 60 recordings of young and mature ChR2-GCs, not shown). Scale bars: 50 pA, 20 ms. (G) Pharmacological blockade of light-evoked PSCs. Example subsequent traces show IPSC and EPSC blockade after bath application of NBQX (20 μM, red bar). Arrows denote the direction of temporal sequences. Scale bars: 100 pA, 40 ms (PC IPSCs) and 50 pA, 20 ms (PC EPSCs and GC IPSCs). (H–J) Synaptic charge of laser-evoked responses. CA3 PC IPSC charge (H): p = 0.09, with N = 13 young and N = 15 mature. CA3 PC EPSC charge (I), p = 0.72, with N = 12 young and N = 13 mature. GC IPSC charge (J): p < 10−4, with N = 26 young and N = 41 mature. All panels depict mean ± SEM. Hollow symbols correspond to the example traces. All statistical comparisons were performed using non-parametric two-tailed Mann-Whitney’s test. See also Figure S2.

