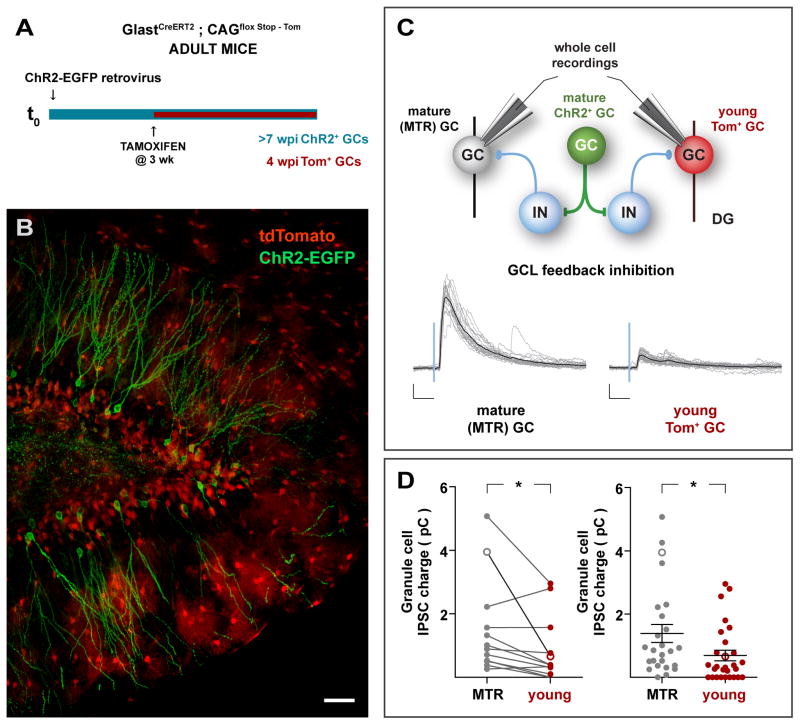
Figure 4. Immature GCs receive weak FBI.
(A,B) Experimental design. Young adult GLASTCreERT2;CAGfloxStopTom mice received a ChR2-EGFP retrovirus in the right DG, followed by administration of TAM 3 – 4 weeks later. Mice were sacrificed 4 weeks later, rendering mature GCs expressing ChR2-EGFP, and young cells expressing Tom, as shown in the confocal image (B). Tom+ astrocytes are also observed, particularly in the molecular layer. Scale bar: 50 μm. (C) Top: Simplified network schematic depicting the recording conditions. Light stimulation of mature ChR2-GCs activate local networks, and whole-cell recordings are obtained from young (Tom+) or mature (unlabeled) GCs to compare the amount of FBI they receive. Bottom: Example recordings depicting light-evoked FBI onto mature (MTR) and young (Tom) GCs. Traces depict all IPSC sweeps in the experiment (gray) and their average (black). Scales: 50 pA, 20 ms. (D) Synaptic charge of laser-evoked responses. Left: Paired analysis of IPSCs evoked onto young and mature GCs recorded within the same optic field. (*) denotes p < 0.02, with N = 13, two-tailed Wilcoxon matched pairs signed rank test. Right: Analysis of all light-evoked IPSC. (*) denotes p < 0.02, with N = 25 mature (MTR) and N = 28 young (Tom), two-tailed Mann-Whitney’s test (data shown as mean ± SEM). In both panels hollow symbols indicate the examples shown in (C). See also Figure S4.

