
Fig. 1.
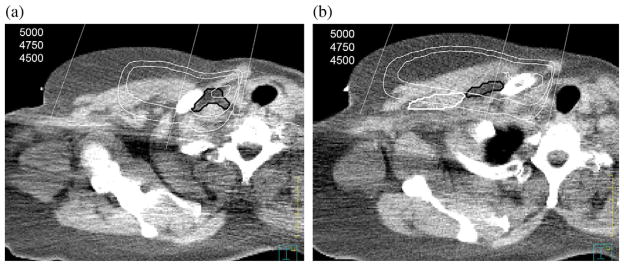
(a) Axial computed tomography (CT) from the CT simulation showing the supraclavicular nodal region outlined in black. The isodose line display is from the “CTopt” plan. (b) Axial CT from the CT simulation showing the axillary level III (LIII) nodal region outlined in black and pectoralis minor muscle was outlined in white. The isodose line display is from the “CTopt” plan.