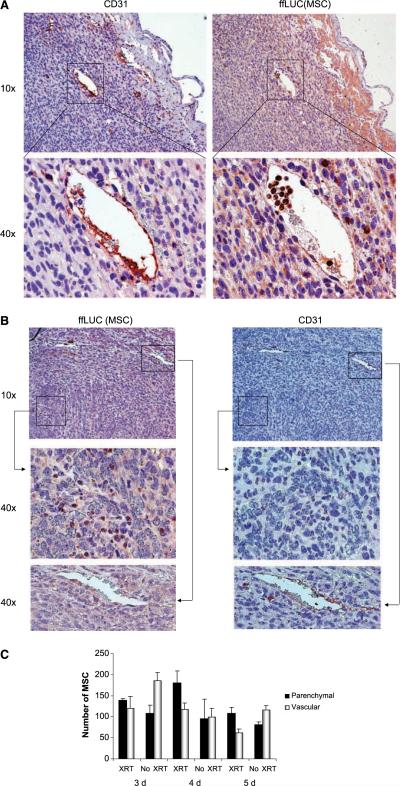
Figure 3.
MSC distribution within unirradiated (A) and irradiated (B) 4T1 tumors. Immunohistochemically stained 4T1 tumors taken 4 days after i.v. injection of MSC. CD31 staining is used to identify the vasculature and ffLUC was used to detect MSC in serial tissue sections. A, MSC are localized primarily to CD31-stained vessels in unirradiated tumors. B, MSC which infiltrated into the parenchyma of an irradiated tumor (top). Middle and bottom, high-power images of designated regions from the top panels: 40× images of a region of high MSC infiltration without CD31-positive vessels (middle); a CD31-positive vessel distant from the region of MSC infiltration into tumor parenchyma (bottom). C, cells in the viable tumor mass were counted and scored as vascular-associated or intraparenchymal. Columns, mean; bars, SE.

