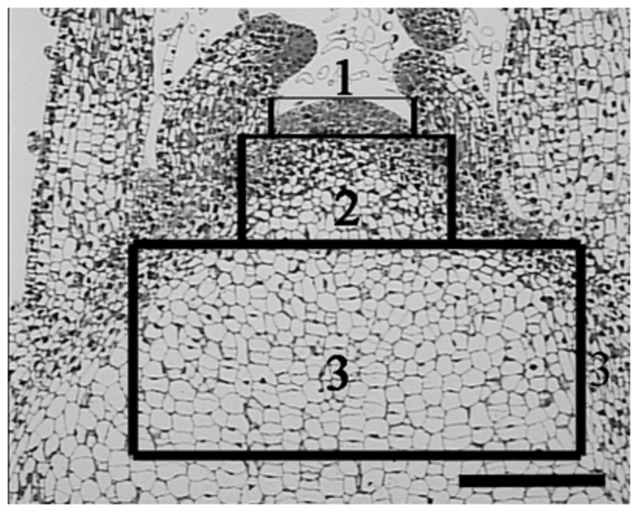
FIGURE 4.

A schematic representation of three zones of SAM used for PD ultrastructure observation and callose deposition. Zone 1 indicates the first four layer cells in the meristem; zone 2 indicates from the fifth cell layer up to the 20th cell layer (about 0.2 mm from top meristem); zone 3 indicates the cells past the 20th layer. Scale bar is 200 μm.
