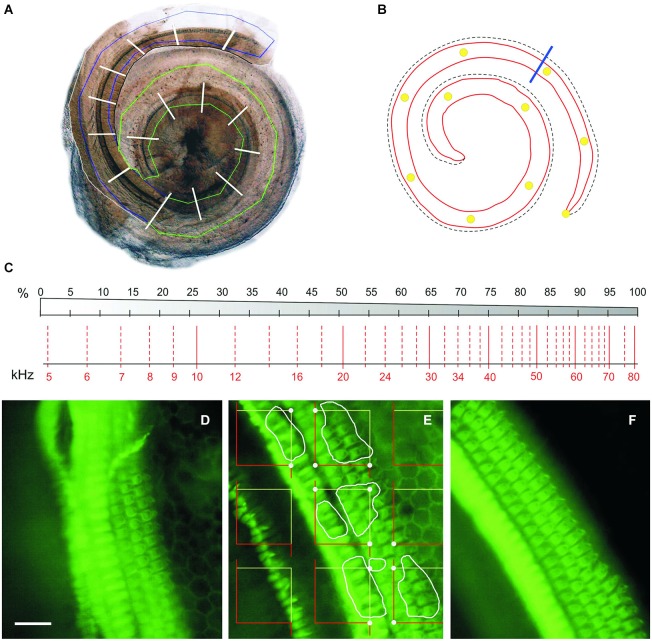
Figure 2.
Cochleogram and stereology. (A) Photomontage of digital images of the two blocks of a CBA mouse dissected cochlea. The region containing the BM is roughly delineated in green (apical-middle block) or blue (basal block); white traverses divide the whole length of the cochlea into 5% intervals. (B) Diagram of the BM of the same cochlea, with 10% intervals marked with yellow dots. The blue line separates the portion reconstructed in A (roughly 80% from the apex) from the basal quarter-turn, which was never included in the reconstruction. (C) Diagram showing a place-frequency map according to Viberg and Canlon (2004) and Müller et al. (2005), which combines a schematic drawing of the BM divided in 5% bins (top) and the corresponding frequency map (bottom). (D–F) Phalloidin-stained whole mounts of portions of the apical (D), middle (E) and basal (F) cochlear turns in a control mouse. The stereological method used to estimate HC densities is summarized in (E): A set of unbiased frames is randomly placed on the stereociliary fringe, the convex hull area bounding the hair tufts of the IHC and OHC; the HCs to be included in the count in this example are delineated by white profiles; dots highlight the frame corners that hit the stereociliary fringe, and serve to estimate the reference space sampled with the frames. Scale: 25 µm. IHC, inner hair cells; OHC, outer hair cells.

