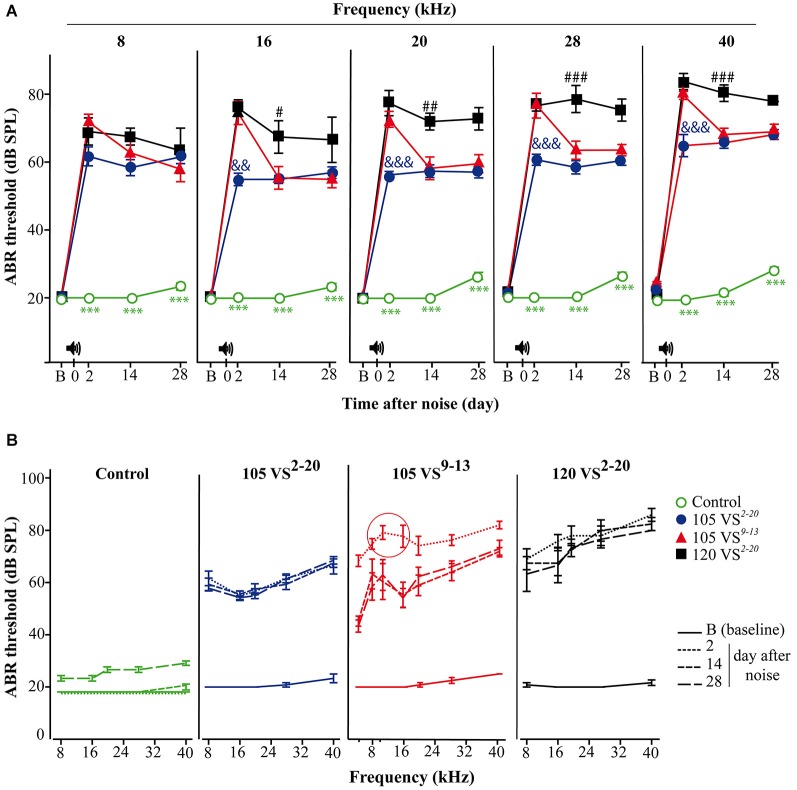
Figure 4.
Evolution of thresholds of tone-evoked ABR. (A) Control non-exposed mice (○, n = 12) maintained baseline (B) hearing thresholds and showed statistically significant differences (p < 0.001, ***) when compared to noise-damaged mice. Noise 120 VS2–20 (■, n = 7) induced the most severe damage (compared to 105 VS noises; # p < 0.05, ## p < 0.01, ### p < 0.001), whereas TSs in 105 VS2–20 (●, n = 11,) were significantly lower (compared to the other noises; && p < 0.01, &&& p < 0.001). Mice exposed to 105 VS9–13 (▲, n = 12,) showed significant early damage followed by a partial, but quick, recovery. (B) Mice exposed to VS noise showed an elevation in the audiogram, compared to control mice. A TS peak in the 105 VS9–13 was evident in response to 8 and 10 kHz. VS, violet swept-sine noise; superscripts indicate the noise frequency range (in kHz); the coefficient indicates the noise level in dB SPL.

