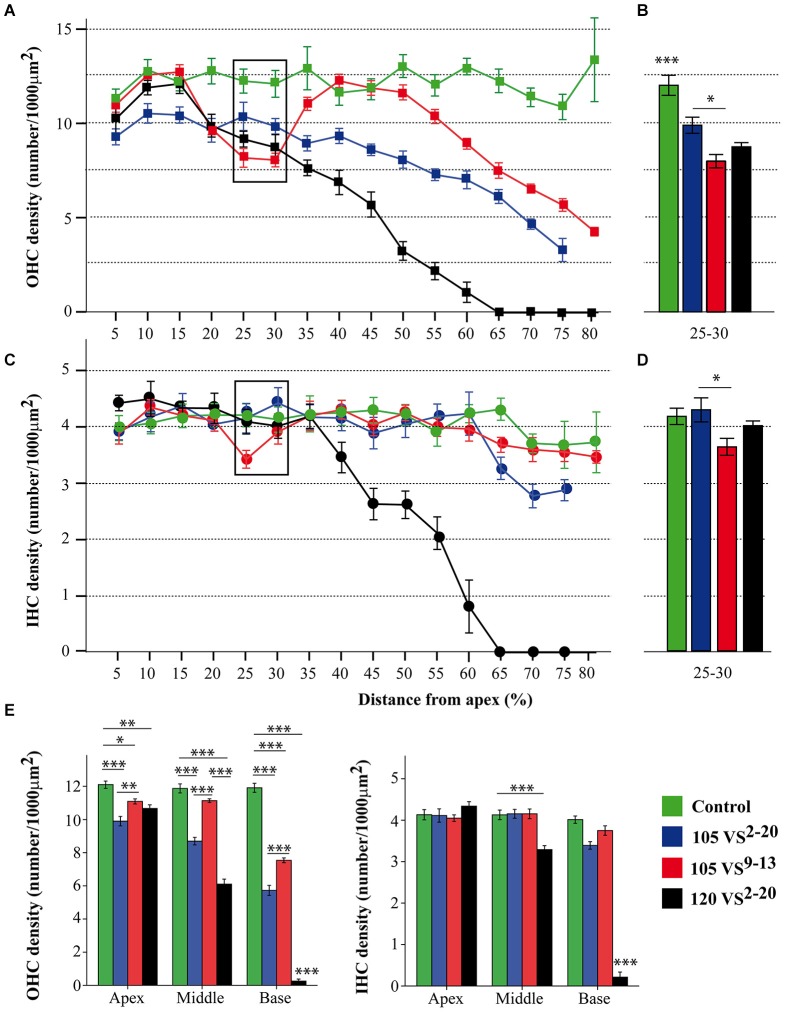
Figure 6.
Hair cell counting data. (A–D) Inner and outer hair cell density (mean ± SEM, expressed as number of cells/1000 µm2) for each 5% sector across the total length of the BM (A,C) and focused on sectors 25–30 (B,D). Exposure to 105 VS9–13 noise induced a significantly higher loss of hair cells in the cochlear region corresponding to sectors 25 and 30 (see Figure 2C) compared to exposure to 105 VS2–20 noise. (E) To better assess regional variations, sectors were grouped into three regions (apex, 5–25; middle, 30–55; base, 60–80) and the mean hair cell density was calculated. Statistically significant differences among groups were found, indicating that exposure to 120 VS2–20 noise induced the most severe damage, especially towards the basal region. * p < 0.05; ** p < 0.01; *** p < 0.001. VS, violet swept-sine noise; superscripts indicate the noise frequency range (in kHz); the coefficient indicates the noise level in dB SPL.

