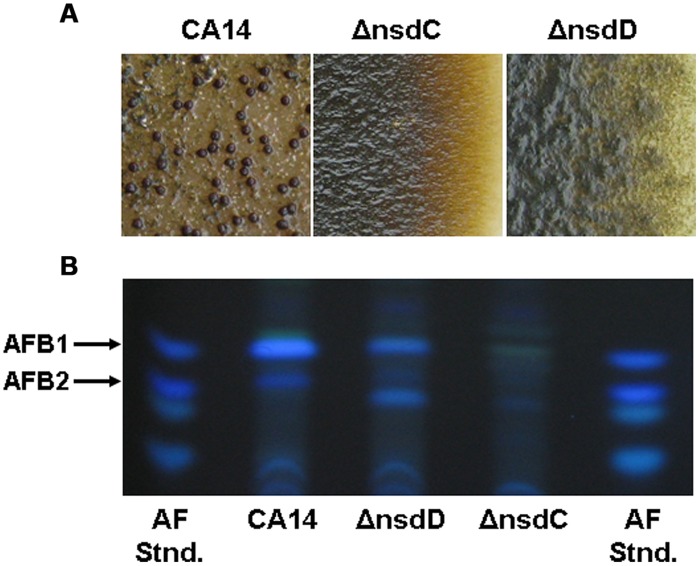
FIGURE 2.
Production of sclerotia and aflatoxins in A. flavus CA14 ΔnsdC and ΔnsdD mutants. (A) Surface of colonies demonstrating sclerotial production after 14 days growth in the dark. Sclerotia were absent in the ΔnsdC and ΔnsdD mutants and were produced in the wild-type CA14 (dark structures). (B) TLC analysis of aflatoxin production from the wild-type CA14, ΔnsdC, and ΔnsdD mutants. Extracts (5 ul) were spotted onto 250 um silica gel TLC plates and metabolites were separated in ethyl acetate: methanol: water (40:1:1). Aflatoxin standards were also spotted on the plate. Adapted and modified from Cary et al. (2012).

