
Figure 1.
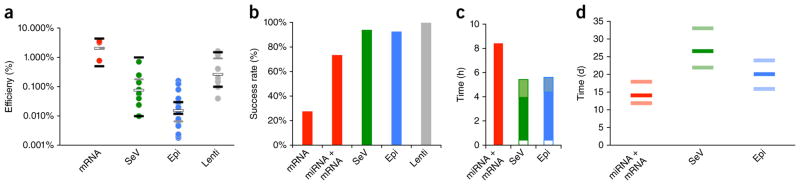
Performance comparison of non-integrating reprogramming methods. (a) Reprogramming efficiencies were calculated as the number of emerging hiPSC colonies per starting cell number; each dot represents the average efficiency of one sample. White bars indicate the mean efficiencies of successful experiments; black bars show the range of efficiencies reported in independent publications (see text); gray bars represent the method-specific means of the three samples that were reprogrammable by all methods. The number of biological replicates was n = 3 samples (a total of 11 biological replicates) for RNA, n = 9 (10) for SeV, n = 17 (25) for Epi and n = 9 (9) for Lenti. (b) Reprogramming success rates for human fibroblast reprogramming experiments using standard protocols. Only experiments yielding at least three colonies were counted as successes. The number of independent samples (biological replicates) was n = 11 for mRNA, 15 for miRNA + mRNA, 85 for SeV, 28 for Epi and 13 for Lenti. (c) Typical total hands-on workload (in hours) was assessed for the three non-integrating human fibroblast-reprogramming methods, until colonies have emerged and grown to a size large enough for picking. The Epi and SeV methods have higher starting cell requirements than the miRNA + mRNA method; the time required to perform the necessary additional somatic cell expansion is shown as a white box. Epi and SeV lines need to be tested for the absence of the reprogramming agents; shaded boxes indicate the workloads of nucleic acid isolation and analysis. (d) Skin fibroblast-reprogramming times (in days), from the first transfection and/or transduction until colonies are ready for picking. Bars show the observed range (light band) and average (dark band) for each method (n = 10 biological replicates for miRNA + mRNA, 44 for SeV and 12 for Epi). All pairwise comparisons reached statistical significance (Student’s t-test, P < 0.01).