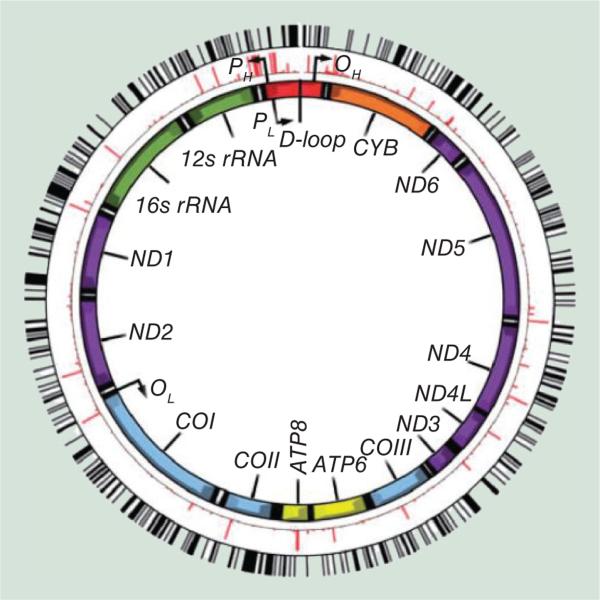
Figure 1. The structure of the mitochondrial genome showing genes encoded by the mitochondria.
3358 mtDNA genetic variants shown in red and black lines highlight the predicted CpG sites relative to mutations that define the mitochondrial haplogroup. PH and PL represent the heavy and light strand promoter regions and OH and OL represent the origins of heavy-strand and light-strand replication, respectively. Reproduced with permission from [19].

