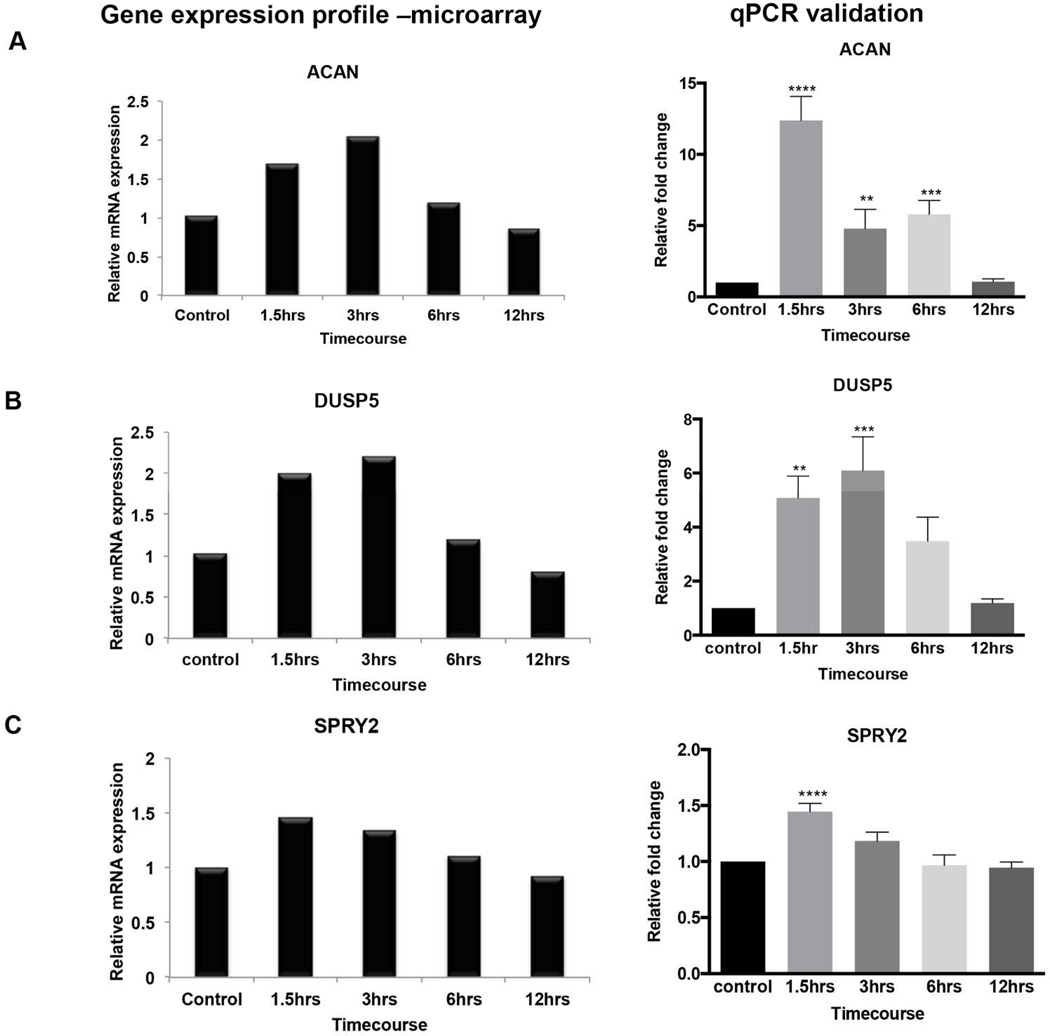
Figure 3.
Microarray expression profiles and qPCR validation of genes from select clusters that were upregulated upon BDNF withdrawal. A-C shows a comparison of the microarray (left panel) and qPCR (right panel) expression profiles for each gene (A) Acan (B) Dusp5 (C) Spry2. Microarray graphs are from the two hybridization experiments described in the methods and are meant to be a comparison to the qPCR results in terms of the pattern of gene expression changes over time. For qPCR validation, at least three independent BDNF withdrawal experiments were done to confirm the expression profiling. Values were normalized using the ddCT method; normalization to the endogenous control relative to untreated control. Error Bars represent standard error of mean (SEM). *p≤0.05, **p≤0.01, ***p≤0.001, ****p≤0.0001.

