Figure 1.
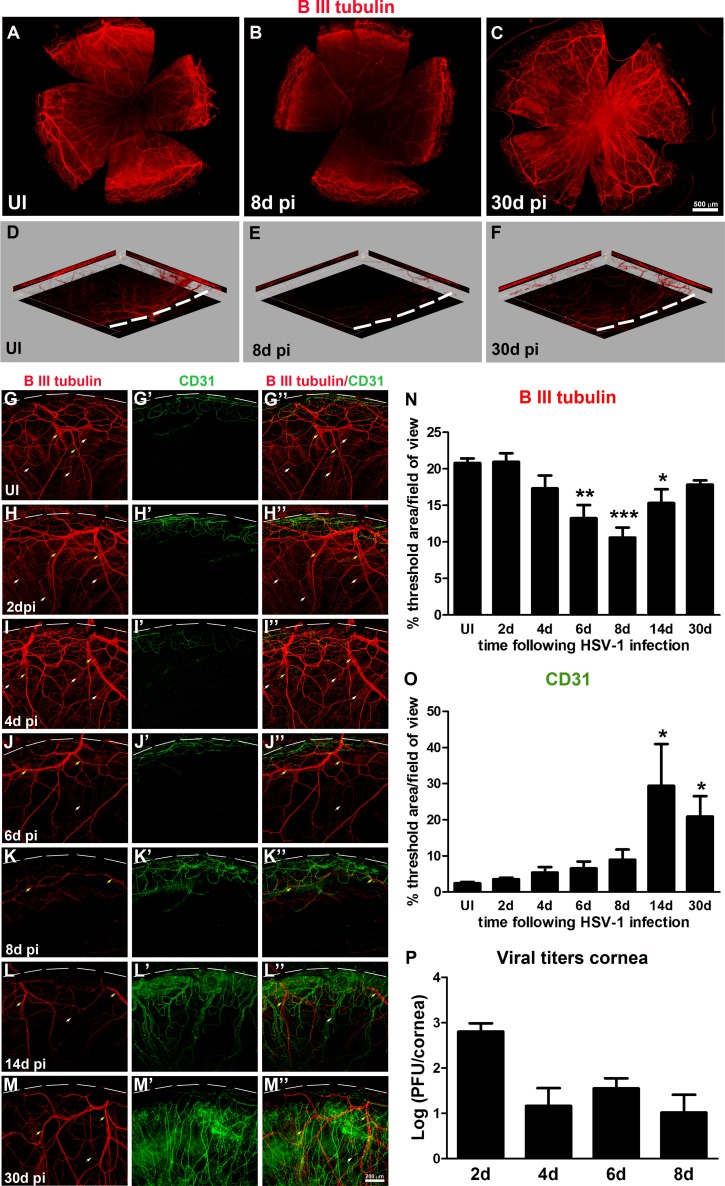
HSV-1 infection results in deinnervation and subsequent reinnervation, consistent with progressive neovascularization of the cornea. Mouse eyes were infected with 103 PFU of HSV-1 or left UI as controls. At 2, 4, 6, 8, 14, and 30 days pi, corneas were processed for IHC staining with β III tubulin (red) and CD31 (green) antibodies. (A–C) Representative corneal whole-mount images. In comparison to UI (A), displaying intact corneal innervation, HSV-1 infection resulted in loss of corneal nerves more pronounced in the center of a 6- and 8-day pi (B) and in the reinnervation process evident at 30 days pi (C). A unique feature observed in some corneas at 30 days pi was abnormal and disorganized hyperinnervation in the center of the tissue. (D–F) Three-dimensional view of representative images showing loss of overall innervation at day 8 pi (E) and regaining innervation at day 30 pi (F). Notice the red signal from β III tubulin-stained nerves, absent throughout the thickness of the optical section (E), and nerve recovery (P). (G–M'') Representative confocal images of UI and infected cornea quadrants oriented with the limbal margins at the top (white dashed lines). Compared to UI (G–G”) displaying intact innervation with thick stromal nerves (yellow arrows) and fine sub-basal nerve bundles (white arrows), HSV-1 infection caused progressive loss of nerves and complete loss of sub-basal nerves at day 8 pi, consistent with the onset of neovascularization of the cornea (K–K''). This event was followed by reinnervation that coexisted with persistent neovascularization (L–L'', M–M''). Corneal innervation and neovascularization were quantified as percentage of threshold area positive for β III tubulin signal (N) and for CD31 signal (O) in representative confocal images (G–M''). Bars represent the percentage of threshold area/field of view ± SEM (n = at least 4 total replicates from 3 independent experiments for each group in (N); and n = at least 3 replicates from 2 independent experiments for each group in (O). *P < 0.01; **P < 0.001; ***P < 0.0001, compared to UI group as determined by ANOVA followed by Newman-Keuls multiple comparison test. (P) Viral content in corneas at 2, 4, 6, and 8 days pi as assessed by viral plaque assay and expressed as log (PFU/cornea) ± SEM (n = 6 total replicates from 2 independent experiments per time point).

