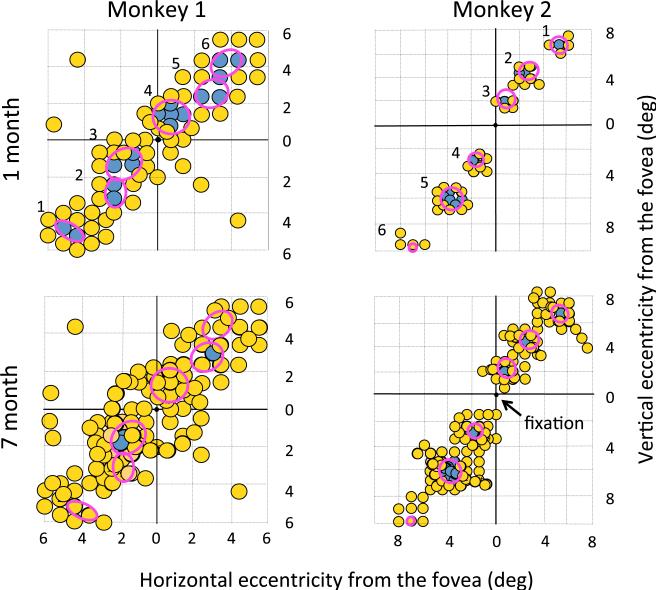
Fig. 6.
Visual performance of the two monkeys at 1 month and 7 months after lesions. Visual orientation discrimination performance across the visual field surrounding lesions 1–6 in monkeys 1 and 2, in the first month following lesions and cumulatively to the 7th month following lesions. Red ovals show the location and size of lesions determined by fundus photography immediately after lesions, and numbers to the left of the ovals show the lesion number (Table 1). Data points show the result of contrast sensitivity testing, yellow points represent performance above 75% correct, indicating locations with visual function, and blue points represent performance below 75% correct, indicating impaired or absent vision. Each data point is approximately 0.8 deg in diameter, a conservatively large representation of the effective size of the Gabor patch of grating that was ±0.3 deg in standard deviation.

