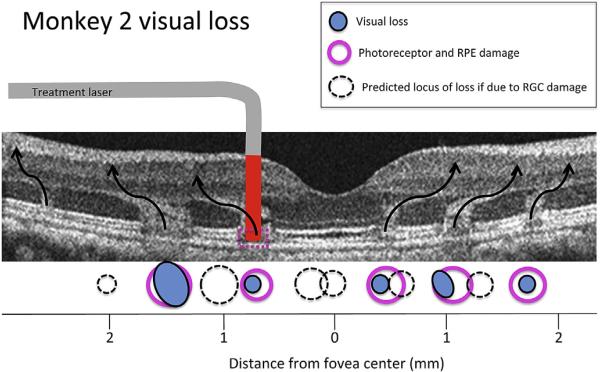
Fig. 7.
Retinal location of visual loss in monkey 2. Mapping of the actual locations of visual loss in monkey 2, (blue circles) and the locus of lesions 1–6 determined from fundus images, OCT imaging and histology, illustrated on the OCT of this monkey taken 24 h after lesion placement. Curved arrows show the approximate flow of visual information from photoreceptors to retinal ganglion cells, based on previous anatomical studies (Schein, 1988) and matched to the altered OCT signal in the ONL that was visible 24 h post-lesion. The cartoon of laser exposure shows that red laser illumination penetrated vertically through the retina. Light-induced damage to the photoreceptors and RPE cells of the outer retina (pink circles) match the locus of visual loss measured psychophysically in lesions 1–6 (blue circles), suggesting that outer retina damage underlies visual loss. If visual loss instead resulted from damage to ganglion cells, through which the laser passed, in the inner retina, the predicted locus of loss would correspond to the dashed circles.

