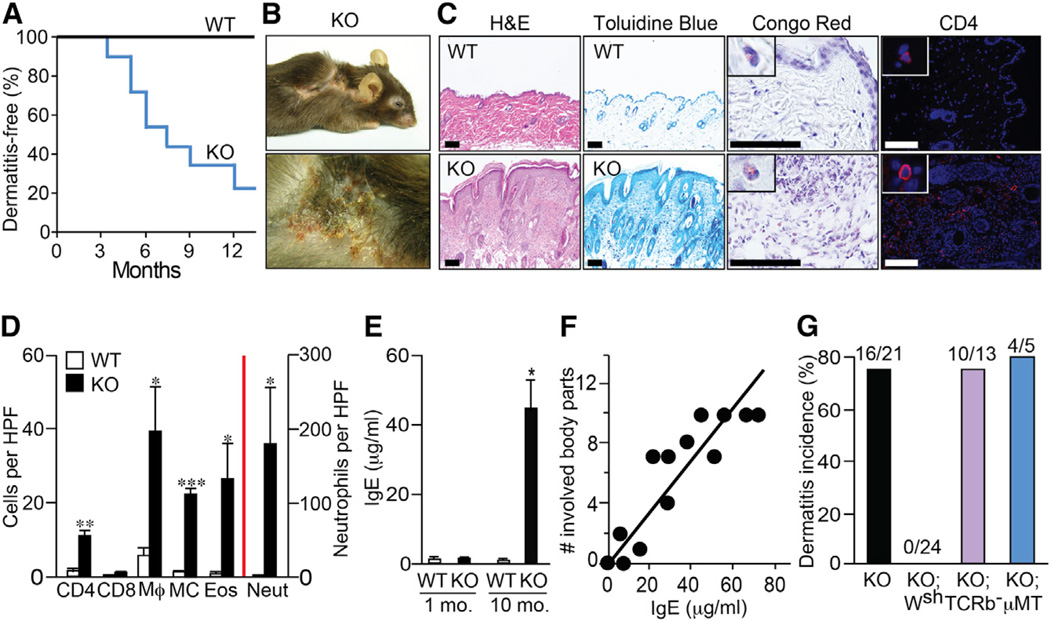
Figure 1. Plcb3−/− Mice Spontaneously Develop AD-like Skin Lesions in a Mast Cell-Dependent Manner.
(A) Kaplan-Meier plots for dermatitis development in Plcb3−/− mice (n = 21).
(B) Note the eczematous skin lesions and hair loss in periocular areas, cheeks, ears, neck, and flanks in a 10-month-old Plcb3−/− mouse.
(C) Histology of healthy (WT) and skin lesions (Plcb3−/−) in ear. Scale bar, 100 µm.
(D) Graphic representation of histological analysis of ear skin lesions of 8- to 10-month-old WT and Plcb3−/− mice. Neutrophils (Neut), eosinophils (Eos), and mast cells (MC) were enumerated in H&E-, Congo-red- and Toluidine-blue-stained preparations, respectively. Immunofluorescence staining was performed to detect CD4+, CD8+, and F4/80+ (Mϕ) cells. Data represent mean ± SEM. *p < 0.05, **p < 0.01, ***p < 0.001 versus WT mice by Student’s t test. Similar results were obtained in lesional skin in cheeks and neck (data not shown). HPF, high-power field.
(E) Serum IgE levels were increased in 8- to 10-month-old Plcb3−/− mice. Data represent mean ± SEM.
(F) Correlation between serum IgE levels and numbers of body parts with skin lesions (see the legend for B for eczematous body parts). r2 = 0.78, p < 0.0001, Pearson’s correlation.
(G) Incidence of skin lesions in Plcb3−/− (KO), Plcb3−/−;KitW-sh/W-sh (KO;Wsh), Plcb3−/−;TCRb−/− (KO;TCRb−) and Plcb3−/−;µMT/µMT (KO;µMT) mice for 12 months.
Results in (E) and (F) are representative of two independent experiments using three to six mice per group. See also Figure S1.

