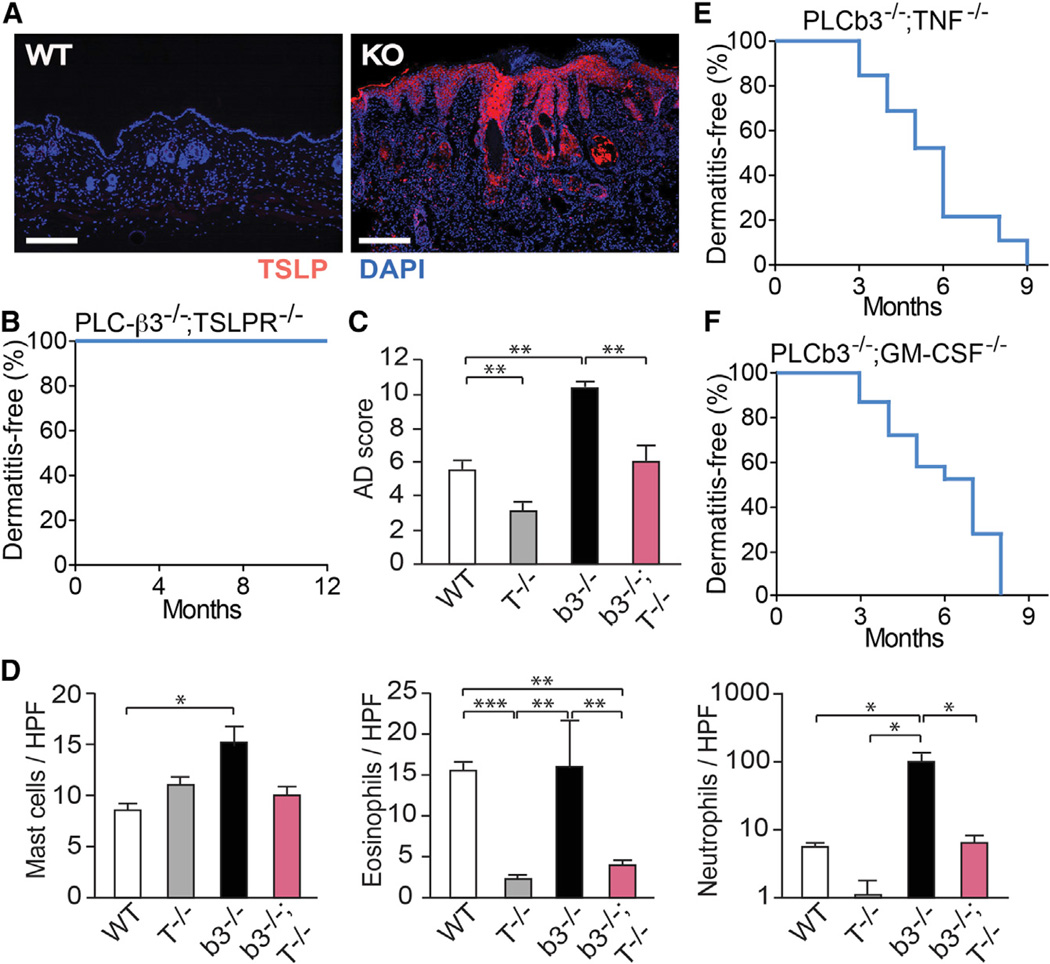
Figure 5. Role of the TSLP-TSLPR Axis in Der f/SEB-Induced Dermatitis and Spontaneous Dermatitis in Plcb3−/− Mice.
(A) Lesional skin from 10-month-old Plcb3−/− mice and healthy control (WT) were stained for TSLP (red) and nuclei (blue).
(B) Kaplan-Meier plots for dermatitis development in Plcb3−/−;TSLPR−/− (n = 10).
(C) Dermatitis was induced with Der f/SEB in WT, TSLPR−/− (T−/−), Plcb3−/− (b3−/−), and Plcb3−/−;TSLPR−/− (b3−/−;T−/−) mice.
(D) Histologic analysis of Der f/SEB-induced dermatitis. Data represent mean ± SEM.
(E and F) Kaplan-Meier plots for dermatitis development in Plcb3−/−;TNF−/− (n = 34), and Plcb3−/−;GM-CSF−/− (n = 31) mice.
Results in (C) and (D) are representative of two independent experiments using three to six mice per group. *p < 0.05, **p < 0.01, ***p < 0.001 by ANOVA. See also Figure S5.

