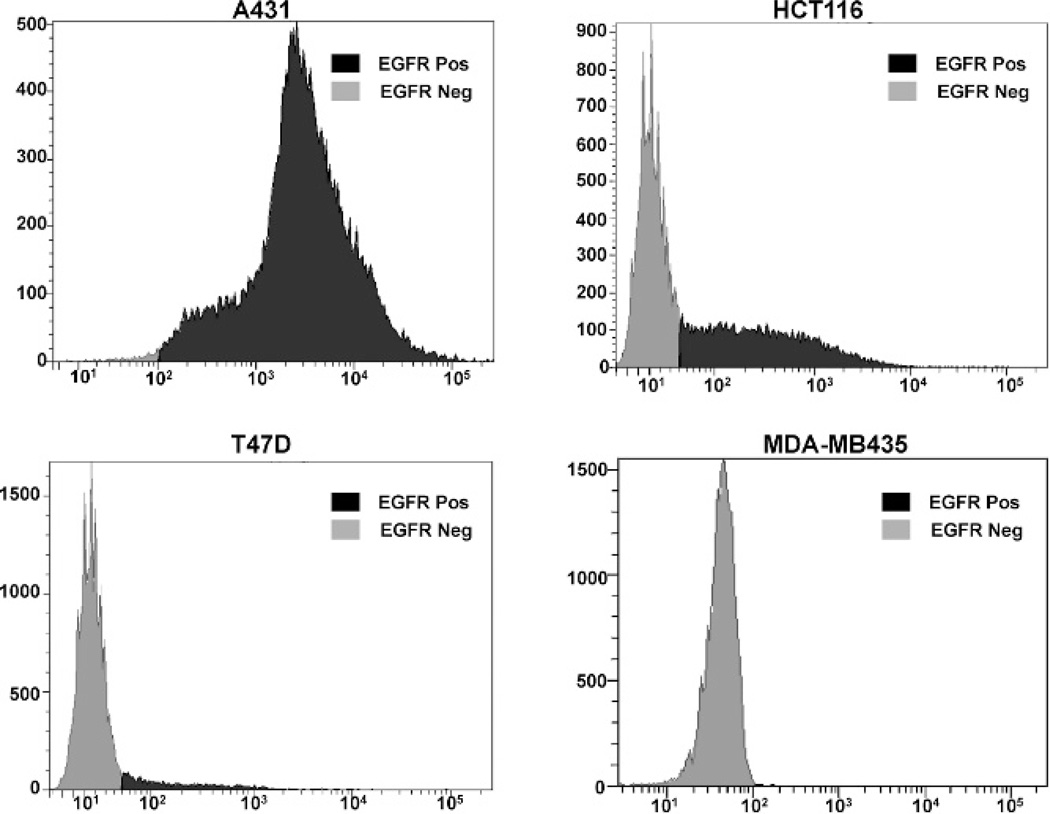
Figure 1.
Flow cytometric analysis of epidermal growth factor receptor (EGFR) expression. The A431 epidermoid carcinoma, HCT116 colorectal cancer, T47D breast cancer, and MDA-MB435 breast cancer cell lines were evaluated for EGFR expression. Panitumumab was used as the primary antibody, and FITC-conjugated goat antihuman IgG was used as the secondary antibody. Data are shown as cell number on the ordinate access and EGFR intensity on the abscissa.

