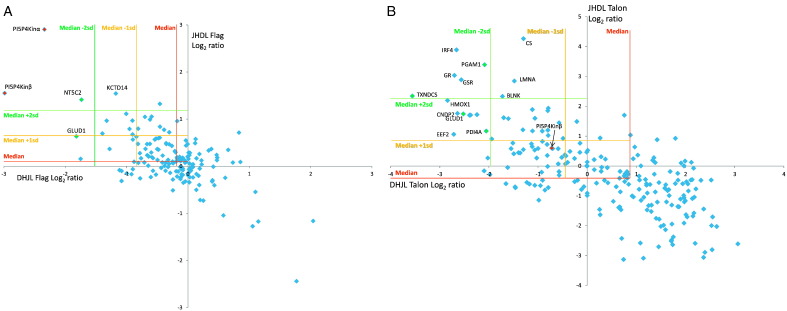
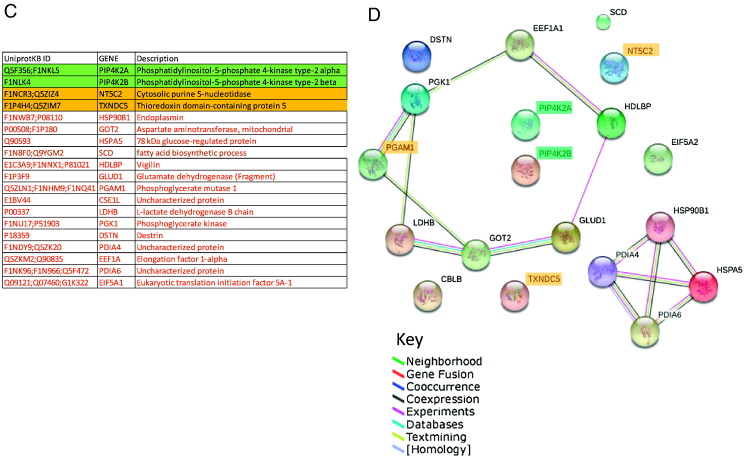
Fig. 3.
(A&B) Scatter plots to show the correlation of Log2 protein ratios from a representative replicate for the PI5P4K2β pull-downs with control DT40 Heavy SILAC labelling, JPR3 Light labelling (DHJL) and the reciprocal labelling experiments (JHDL) respectively for FLAG (A) and TALON (B). (C) List of significant (> 1SD of median) proteins from FLAG and TALON pull-downs of 4 combined replicates with green, orange and red being high, medium and low confidence respectively. (D) STRING interaction map of the significant candidates. (See Supplemental Tables S4 for full list of identified proteins and ratios.)


