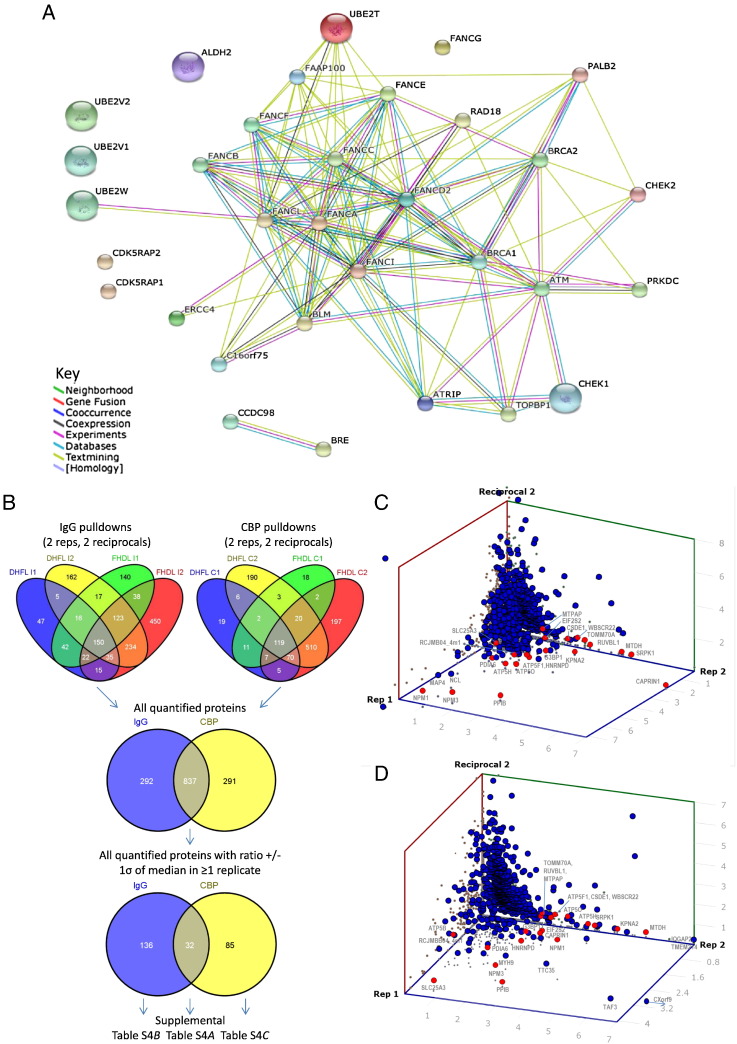
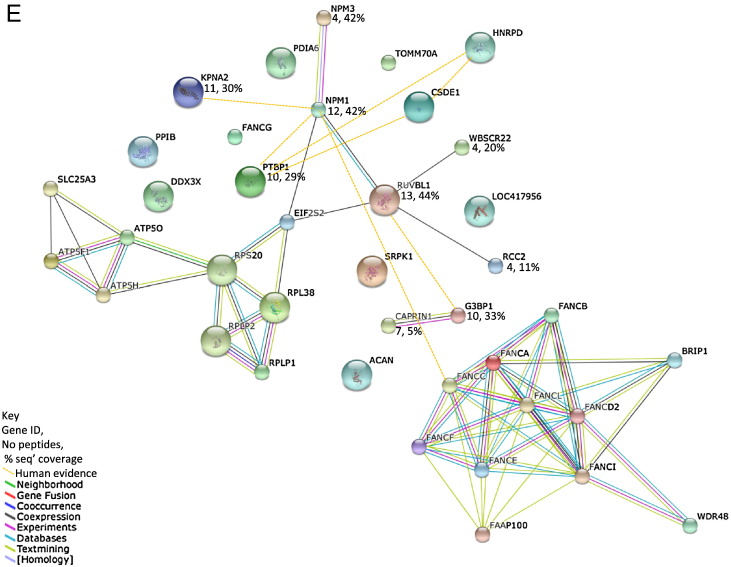
Fig. 4.
(A) STRING interaction map of the known protein candidates present only associated with tagged FANCC using the Gallus gallus database. (B) Venn diagrams to show replicate reproducibility of all quantified identifications from the two parallel affinity pull-down approaches. (C) Scatter plots to show the distribution of protein ratios for the FANCC calmodulin pull-downs for DT40 Heavy SILAC labelling, FANC Light labelling (DHFL) and the reciprocal labelling experiments (FHDL) respectively and (D) IgG pull-downs that showed ratios +/− > 1SD from the median ratio. (E) STRING interaction map of the newly identified protein candidates in both calmodulin IgG pull-downs. (See Supplemental Fig. S9 for tag specific interactors).


