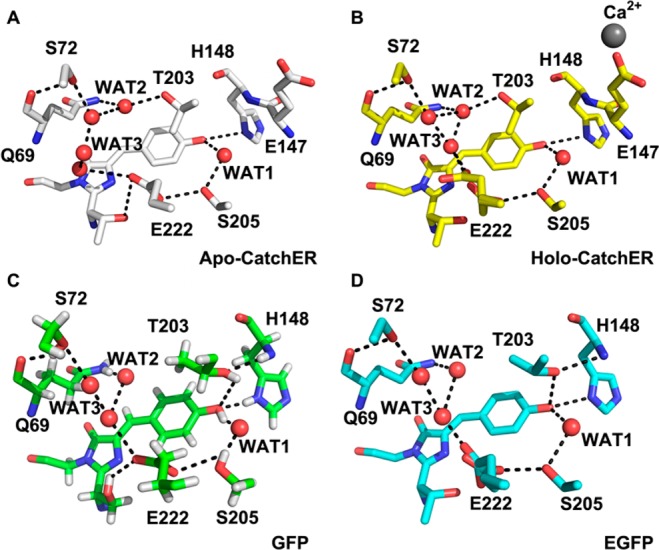
Figure 9.

Comparison of the crystal structures of (A) apo-CatchER (PDB ID: 4L13), (B) Ca2+-CatchER (PDB ID: 4L1I), (C) GFP (PDB ID: 2WUR), and (D) EGFP (PDB ID: 4EUL). The H bonds are shown in the black dash line with the cutoff of 3.5 Å. Only side chains were shown in S72, T203, S205, and E222.
