
Figure 4.
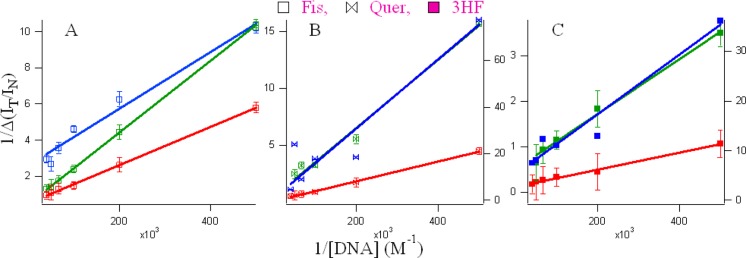
Double reciprocal plots using the IT/IN values from the spectral profiles of the flavonoids (A) fisetin, (B) quercetin and (C) 3HF in the various microenvironments of DNA (green, G4; blue, C4; and red, duplex).
Official websites use .gov
A
.gov website belongs to an official
government organization in the United States.
Secure .gov websites use HTTPS
A lock (
) or https:// means you've safely
connected to the .gov website. Share sensitive
information only on official, secure websites.
Double reciprocal plots using the IT/IN values from the spectral profiles of the flavonoids (A) fisetin, (B) quercetin and (C) 3HF in the various microenvironments of DNA (green, G4; blue, C4; and red, duplex).