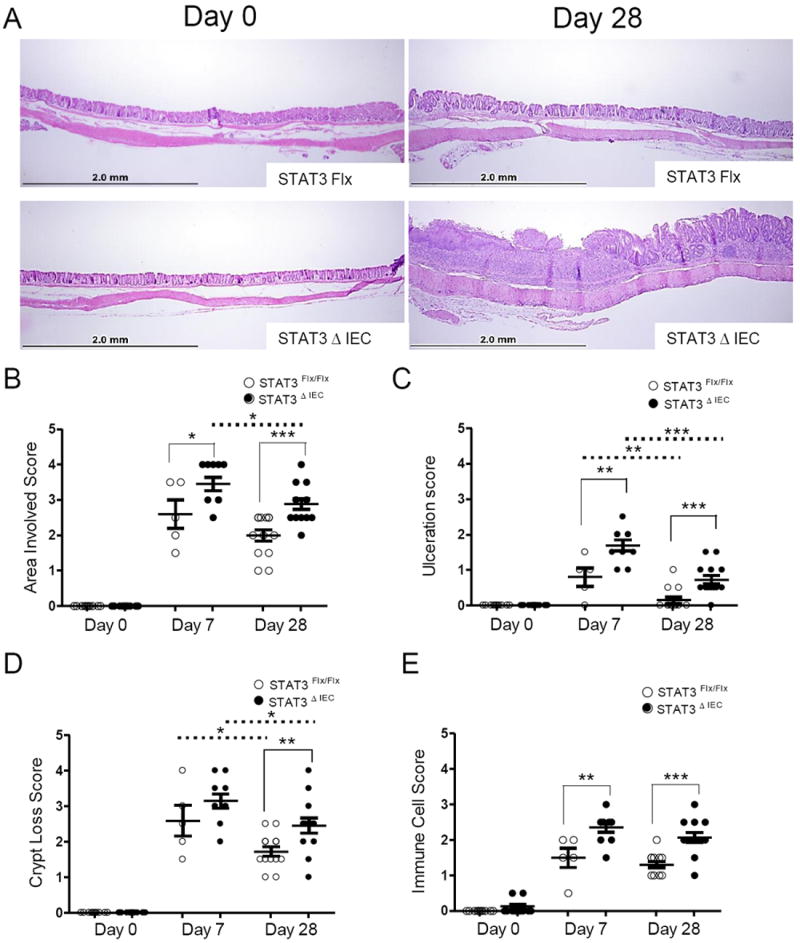
Figure 2. All histologic sub-scores are increased in Stat3ΔIEC mice compared to Stat3Flx/Flx littermate controls at day 28.

(A) Representative images from the same segment of the colon at day 0 and day 28 utilizing the anal verge as an anatomical landmark. Original magnification was 100x. (B) Area involved, (C) epithelial monolayer ulceration (D) crypt loss and (E) extent of immune cell infiltration are shown at day 7 and day 28 (n>5 mice per group, per genotype). Data are shown as mean ± SEM. Differences within (dotted line) and between (solid line) genotypes were analyzed by one-way ANOVA with Bonnferroni post-test (* p < .05; ** p < .005; *** p < .0001).
