
Figure 3. IEC proliferation and apoptosis do not differ at day 28 between Stat3ΔIEC mice and littermate controls.
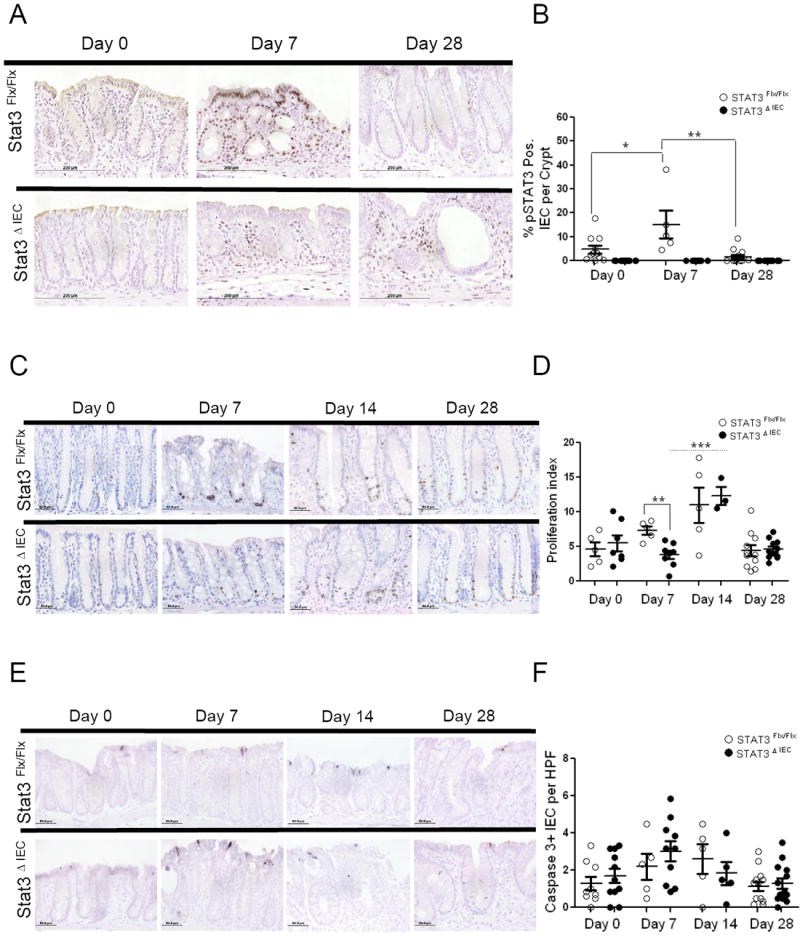
(A) Imuno-histochemical analysis of phophos-STAT3 (pSTAT3) quantified as (B) the percentage of IECs positive for pSTAT3 per crypt at day 0, day 7 and day 28, as an average of 12 properly oriented crypts/mouse. (C) Immuno-histochemical analysis of proliferation measured by BrDU incorporation expressed as (D) a proliferation index at day 0, day 7, day14 and day 28 as an average of 12 properly oriented crypts/mouse. (E) Apoptosis measured by cleaved caspase-3 quantified as (F) the number of positive cells per HPF at day 0, day 7, day 14 and day 28, as an average of six fields counted per mouse. Analysis was performed in .5 cm area of mucosa that bordered ulcers in the distal and middle colon or in corresponding areas of the colon if no ulcer was found. Data are shown as mean + SEM (n>5 mice per genotype). Differences within and between genotypes were compared by un-paired t-test (*p < .05 and ** p < .005).