
Figure 2.
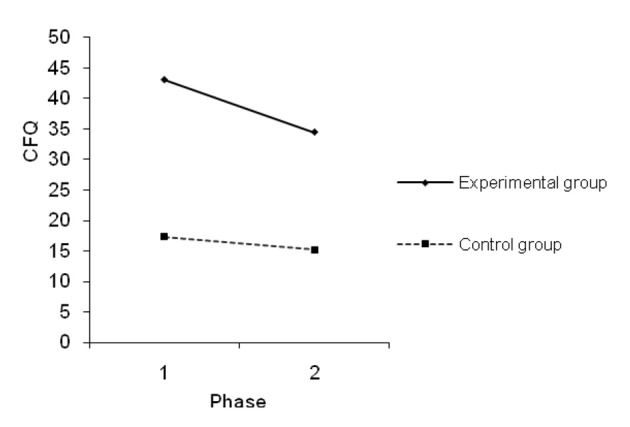
Mean values on CFQ for the first and second phases on the experimental and control groups.
Official websites use .gov
A
.gov website belongs to an official
government organization in the United States.
Secure .gov websites use HTTPS
A lock (
) or https:// means you've safely
connected to the .gov website. Share sensitive
information only on official, secure websites.
Mean values on CFQ for the first and second phases on the experimental and control groups.