
Figure 3.
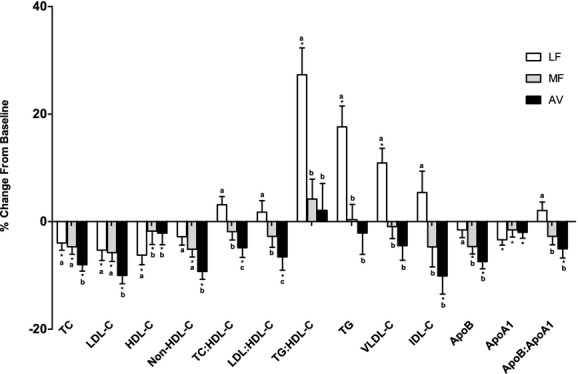
Percent change in lipids, lipoproteins, and apolipoproteins (mean±SEM) from baseline. *Represents values that are significantly different from the baseline (P<0.05). Values with different letters (a, b, and c) are significantly different (Tukey post‐hoc test by SAS, P<0.05). AV indicates avocado diet; apoA1, apolipoprotein A1; apoB, apolipoprotein B; HDL‐C, high‐density lipoprotein cholesterol; IDL‐C, intermediate‐density lipoprotein cholesterol; LDL‐C, low‐density lipoprotein cholesterol; LF, lower‐fat diet; MF, moderate‐fat diet; TC, total cholesterol; TG, triglycerides; VLDL, very‐low‐density lipoprotein.