
Figure 6.
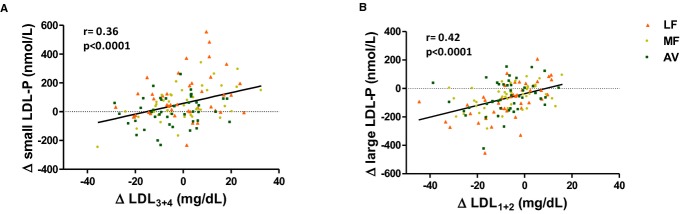
(A) Correlation between the change in small LDL‐P and the change in LDL3+4; (B) correlation between the change in large LDL‐P and the change in LDL1+2. AV indicates avocado diet; LDL, low‐density lipoprotein; LDL‐P, low‐density lipoprotein particle number; LF, lower‐fat diet; MF, moderate‐fat diet.