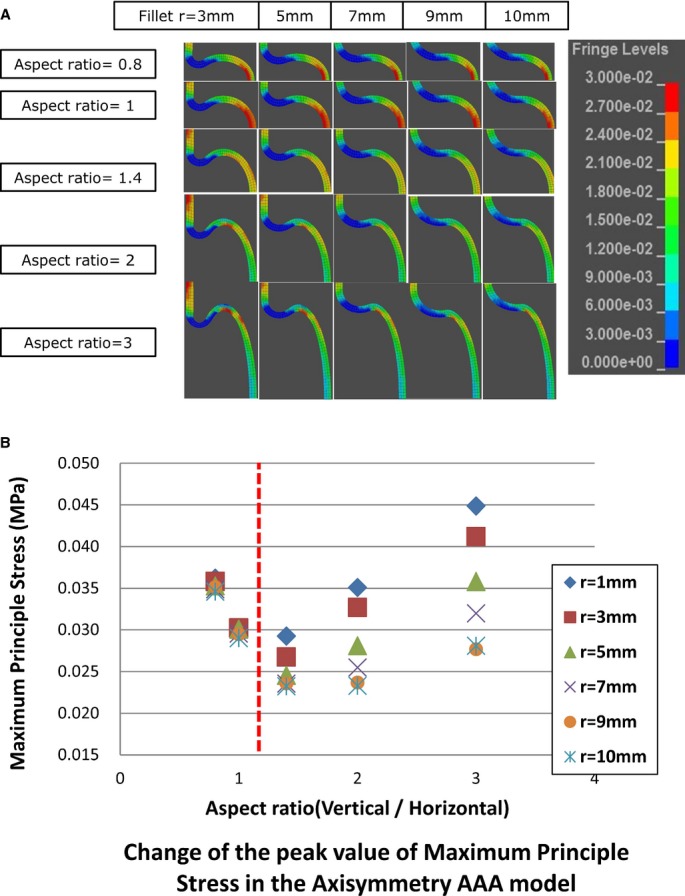
Figure 5.

A, Visualization of the MPS on the aortic wall in the fillet model. The portion of the normal aorta colored red is an artifact due to the boundary condition. B, Change in the peak value of the MPS in the axisymmetric model. AAA indicates abdominal aortic aneurysm; MPS, maximum principal stress.
