
Figure 6.
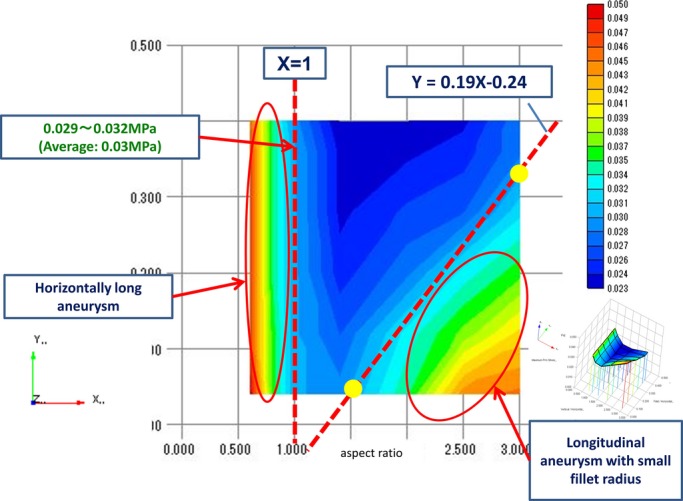
Three‐dimensional distribution map of the MPS with 3 axes; the peak value of the MPS, vertical diameter/horizontal diameter (aspect ratio), and fillet radius/vertical diameter (right). Modified 2‐D graph of the MPS distribution map viewed from the direction of the z axis (left). MPS indicates maximum principal stress.