Figure 2.
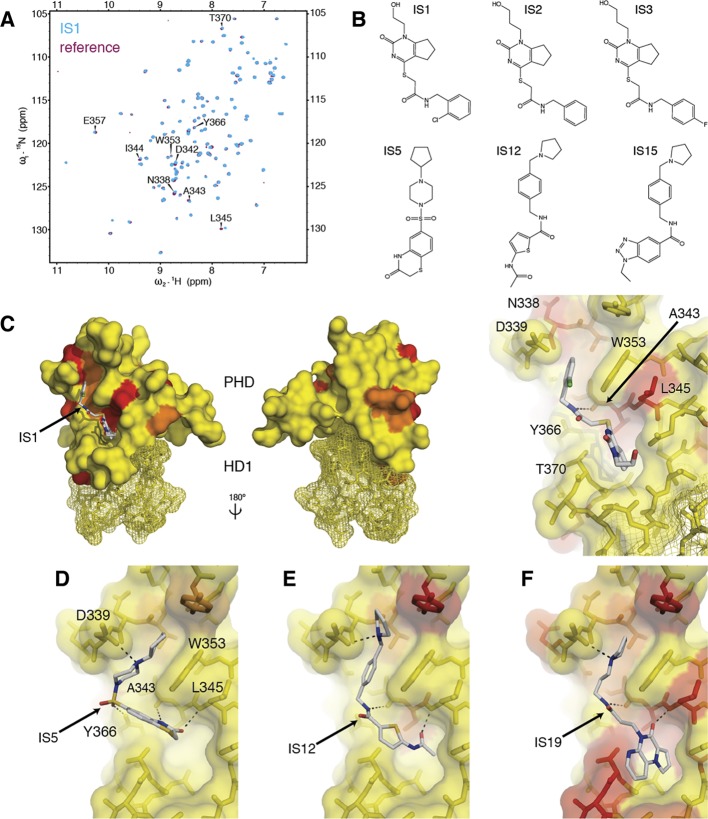
In silico hits binding to PHD–HD1. (A) Overlay of HSQC spectra of 50 μM 15N-labeled PHD–HD1 + 1 mM IS1 (cyan) onto PHD–HD1 alone (maroon), with residues experiencing CSPs labeled. (B) Structure of IS1–3 and IS hits used in D–F. (C) Heat-maps of CSPs elicited by IS1 projected onto the structure of PHD–HD1 (2XB1; coloring thresholds: yellow <0.04 ppm; orange <0.1 ppm; red <0.15 ppm) and calculated docking pose (in stick representation; red, oxygen; blue, nitrogen; yellow, sulfur; green, chlorine); front and rear views as in Figure 1B (HD1, mesh representation) and zoomed-in view at the right, with key interacting residues labeled (note L345 whose side-chain fills the R2 cavity found in other PHD fingers in this position, see text). (D–F) Docking poses of representatives of each IS group (Figures S1 and S2), as indicated in the panels.

