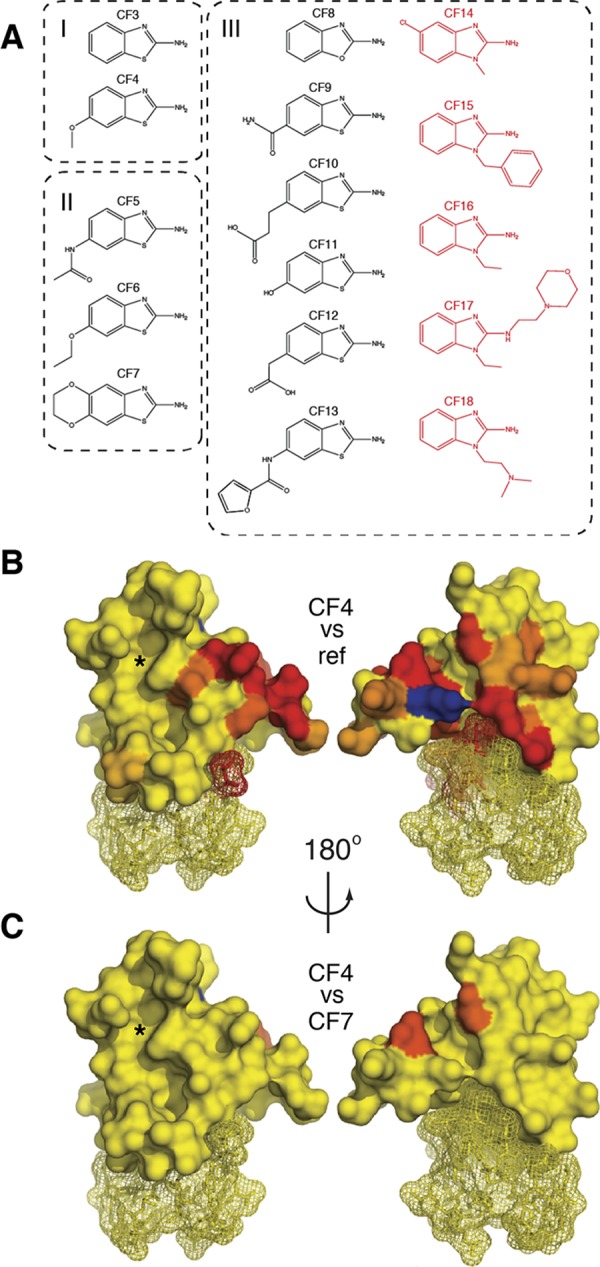
Figure 4.

Identifying the benzothiazole binding site. (A) SAR defining three groups of chemical relatives of CF1 that bind to PHD–HD1. In red is the subset of compounds (extended at N1) that acquired a distinct binding site on PHD–HD1 (see also Figures 6 and 7). (B) Heat-maps of CSPs induced by CF4 (coloring and views as in Figure 2C; blue, peak exchange broadening); left, front surface, with histone-binding pockets (indicated by asterisk); right, rear surface. (C) Differential heat-map (coloring and views as in B), representing the ratios of CSPs induced by CF7 versus CF4, which identifies the benzothiazole binding site at the rear surface of PHD–HD1 (see also Figure 5).
