Figure 4.
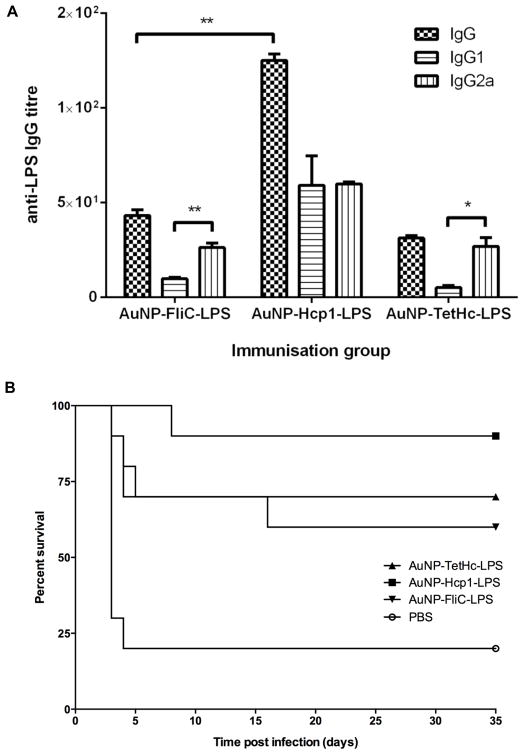
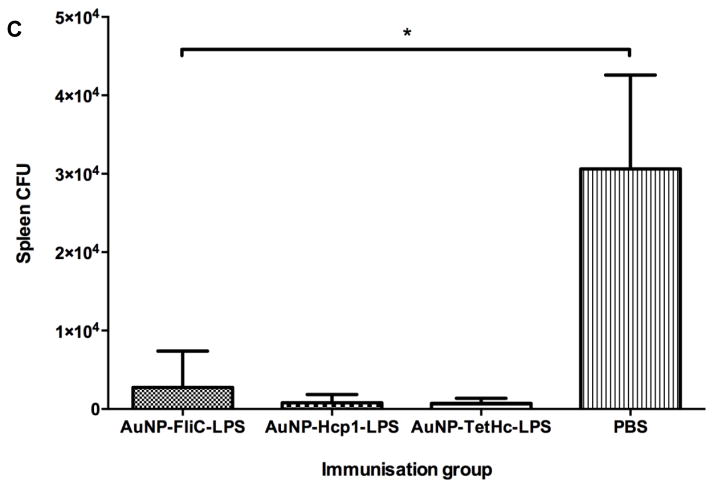
LPS specific IgG and IgG subclass titres in sera collected from groups of eight mice, five weeks post-first immunisation with the antigen indicated and determined using ELISA (A). Survival curve for groups of 9 BALB/c mice challenged IN with 2.62 × LD50 B. mallei China7, 3 weeks post-last IN immunisation with 3 × 50 μL doses of AuNP-FliC-LPS, AuNP-Hcp1-LPS or AuNP-TetHc-LPS (B). Colony counts of B. mallei in spleens three days post challenge. Each point is the mean of values from five mice. (C). Error bars are calculated using the standard error of the mean. * p < 0.05, ** p < 0.01.


