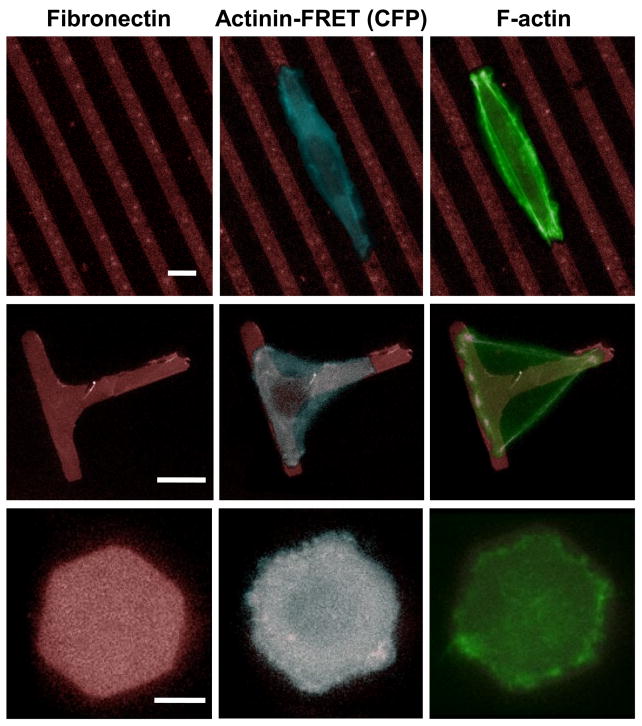
Figure 2.
Images of cells expressing actinin-sstFRET on patterned substrates. Left panel: Geometry of three patterns, parallel stripes, T-shape and hexagon. Middle panel: Fluorescence images of actinin-sstFRET (CFP channel, blue) in live cells on patterned fibronection (red). The images were taken 2 hours after seeding. Right panel: Immuno-stained actin (green) after cells were stabilized on the patterns, showing the formation of actin bundles at the cell periphery when it expands to the restricted regions (middle region on stripes and the bridges on T-shape pattern). Scale bars represent 10 μm.

