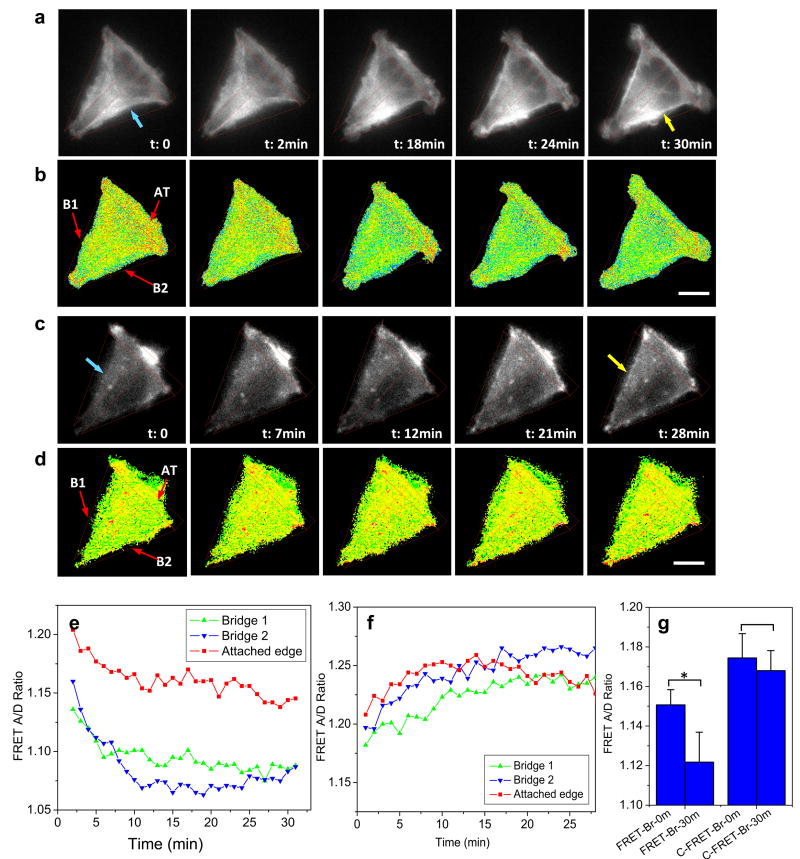
Figure 4.
Time-dependent changes in actinin tension and corresponding cytoskeleton reorganization in cells grown on T-shape pattern. a,b: Live cell fluorescent images of actinin-sstFRET (CFP channel) and corresponding FRET ratio, showing correlated changes of actin structure and tension during cell spreading on the T-shape pattern. c,d: Same recording for actinin-C-sstFRET. e,f: Time-dependent changes in tension in selected regions indicated in (b and d), bridges (B1 and B2) and attached edge (AT), using actinin-sstFRET and actinin-C-sstFRET probes, respectively. g: Change in actinin tension in bridged regions before and after 30 min of spreading. The data is averaged from multiple cells (n=15, *p = 0.013) and the control cells (n = 5, p = 0.4). Scale bars represent 10 μm.

