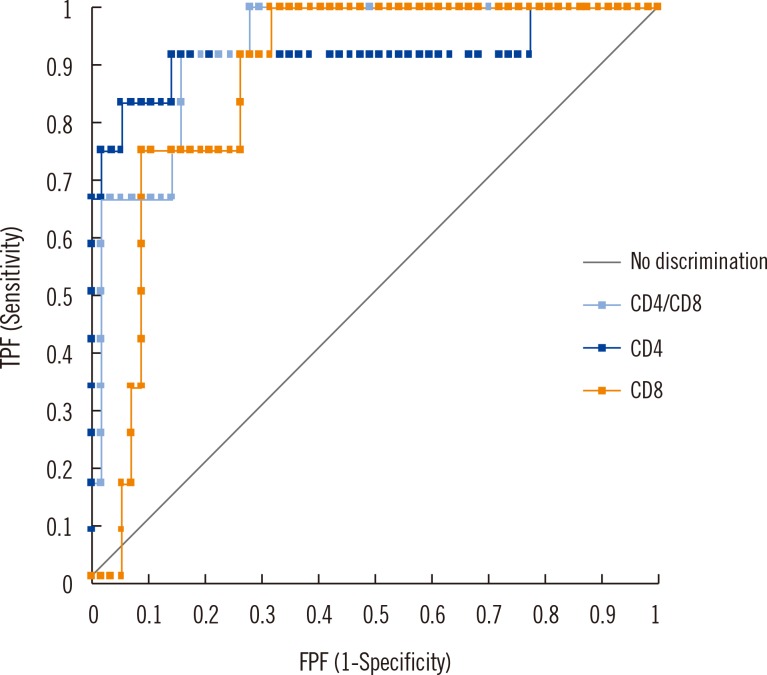
Fig. 2.
Comparison of ROC curve for sarcoidosis (CD4, CD8, and CD4/CD8). The ROC curve for sarcoidosis diagnosis shows that the area under curve (AUC) was 0.918, 0.873, and 0.930 for CD4 cell %, CD8 cell %, and CD4/CD8 ratio, respectively, but no statistical difference was found among the variables (P>0.13). Based on the Youden index, cut-off of CD4/CD8 ratio for sarcoidosis was determined at 2.16, with sensitivity of 91.7% (95% CI, 61.5-98.6%) and specificity of 84.2% (95% CI, 72.1-92.5%).
Abbreviations: TPF, true positive fraction; FPF, false positive fraction.

