Figure 3.

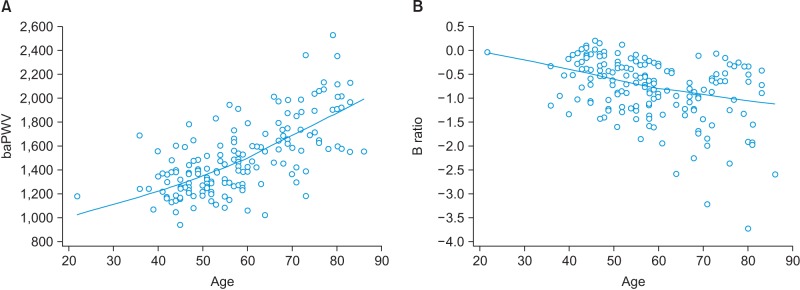
Scatter diagrams of the relationship between the brachial-ankle pulse wave velocity (baPWV) and age (A) and the relationship between the B ratio of the acceleration photoplethysmogram and age (B).

Scatter diagrams of the relationship between the brachial-ankle pulse wave velocity (baPWV) and age (A) and the relationship between the B ratio of the acceleration photoplethysmogram and age (B).