. 2015 Jan 31;21(1):30–34. doi: 10.4258/hir.2015.21.1.30
© 2015 The Korean Society of Medical Informatics
This is an Open Access article distributed under the terms of the Creative Commons Attribution Non-Commercial License (http://creativecommons.org/licenses/by-nc/3.0/) which permits unrestricted non-commercial use, distribution, and reproduction in any medium, provided the original work is properly cited.
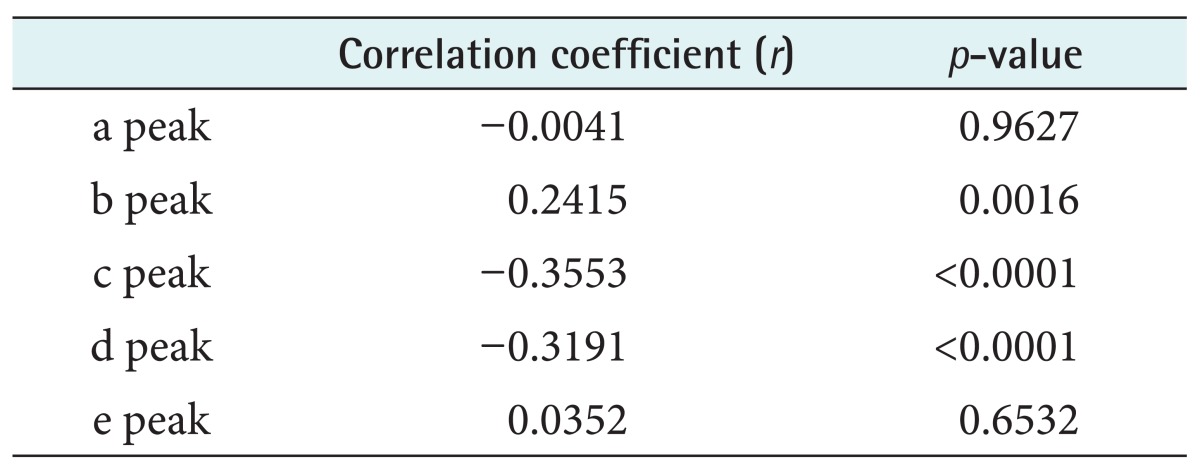
Table 2.
Pearson correlation of the a, b, c, d, and e peaks with age

