Fig. 10.

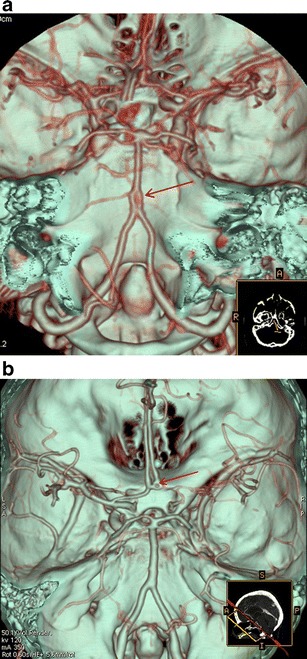
a CTA (VRT 3D reconstructions) shows a proximal basilar artery fenestration (red arrow). b CTA (VRT 3D reconstructions) shows an Acom artery fenestration (red arrow)

a CTA (VRT 3D reconstructions) shows a proximal basilar artery fenestration (red arrow). b CTA (VRT 3D reconstructions) shows an Acom artery fenestration (red arrow)