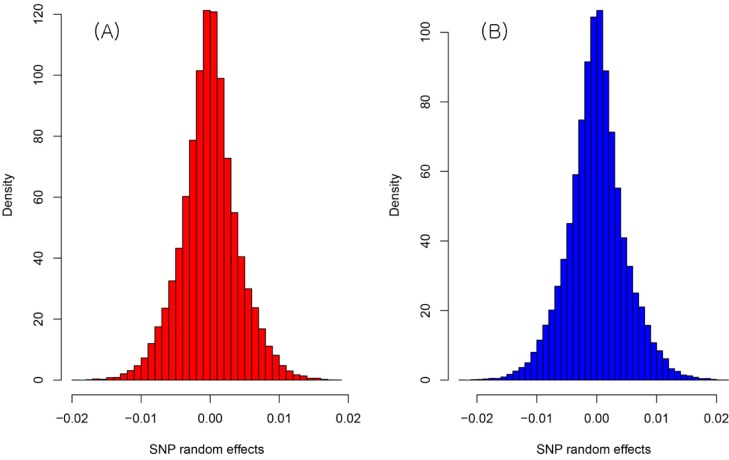
Fig. 2.
The histogram of the SNP effects of SNP-BLUP (A) and SNP-GBLUP (B). They were approximately distributed normally. However, the predicted genetic values were very dissimilar. SNP-BLUP, single nuleotide polymorphism (SNP)-best linear unbiased predictor; SNP-GBLUP, SNP-genomic linear unbiased prediction.

