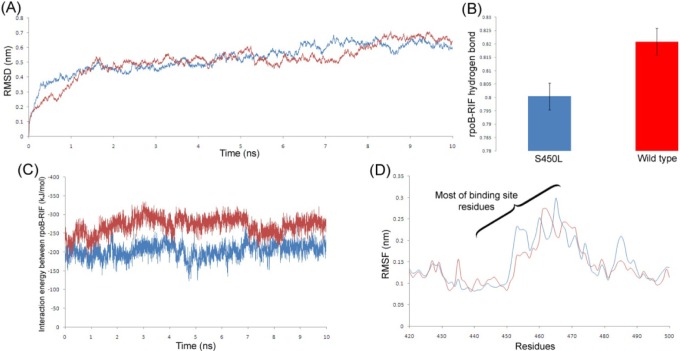
Fig. 5.
(A) Root Mean Square Deviation plot of rpoB wild-type and S450L mutant. (B) Occurrence of hydrogen bonds between rpoB and rifampicin (RIF) throughout the simulation with standard deviation. (C) Interaction energy profile between rpoB and RIF. (D) Root Mean Square Fluctuation plot comparison of wild-type and S450L mutant near the binding site region. Red and blue are used for the wild-type and S450L mutant, respectively.

