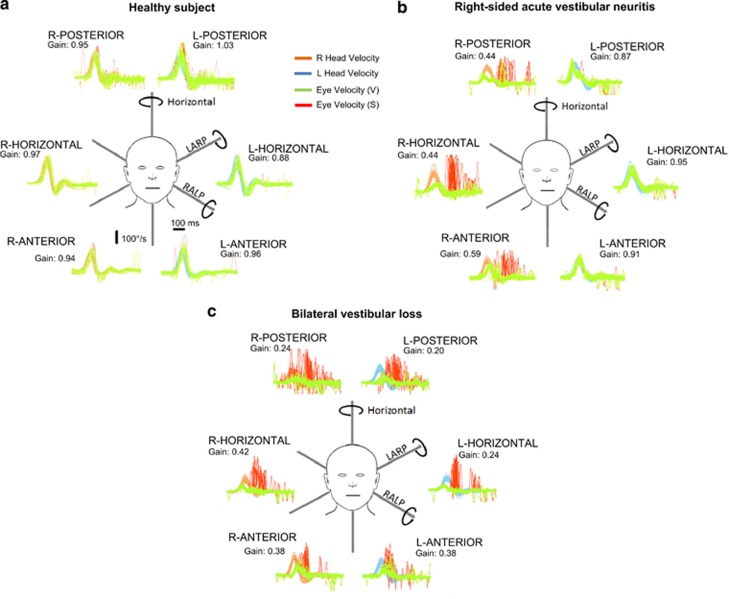
Figure 4.
The plots represent time series showing superimposed recordings of the head velocity stimulus (brown for right canals and blue for left canals) and the slow-phase eye-velocity responses (eye velocity VOR—green traces) to 20 randomised (either direction) head turns, to sequentially test all the semicircular canals in turn in (a) a healthy subject, (b) a patient with right-sided acute vestibular neuritis and (c) a patient with bilateral vestibular loss. Overt or covert saccades are shown as red traces, and can be seen when testing the side of the lesion in the vestibular neuritis patient (ie, right) and when testing both the right and left sides of the patient with bilateral vestibular failure. Note that in this figure the eye velocity has been inverted to allow for a comparison with head velocity, and for illustration purposes only both leftward and rightward head movements are shown as positive. The average VOR gain value (eye velocity/head velocity) is shown next to each response.

