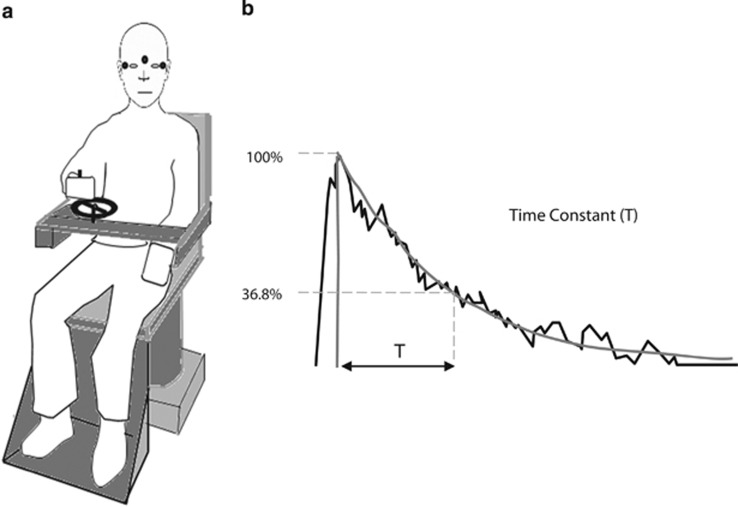
Figure 5.
Diagrammatic representation of the vestibular perception test. (a) Subject is shown holding the handle of a tachometer wheel, which the subject is instructed to turn as to indicate their subjective perception of the rotational stimuli during 90°/s chair rotation either to the right or left. EOG electrodes seen in the figure by small black circles simultaneously capture nystagmus thus allowing us to compare vestibulo-ocular and vestibulo-perceptual responses. Subjects are instructed to turn the wheel as fast as possible initially on chair acceleration or deceleration for the first couple of seconds. From then on, the subject is asked to slow down the turning of the tachometer wheel gradually to match their own perceived turning sensation and eventually stop turning the wheel at the point that they no longer feel the rotation. (b) Tachometer output in a normal subject during a rotational stopping response. This output is fitted with an exponential curve and the time constant of decay is measured (typically between 15–18 s).

