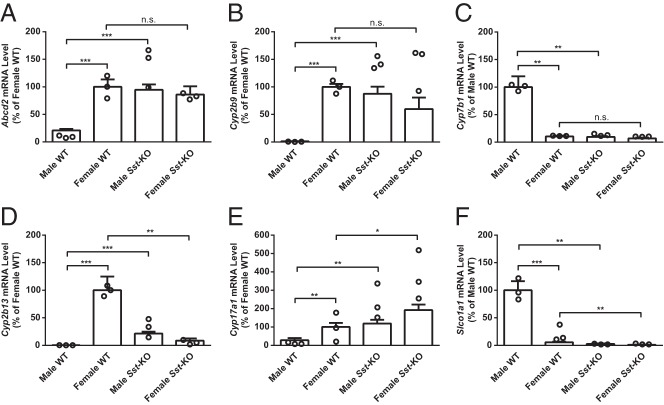
Figure 4.
qRT-PCR validation of the microarray results. mRNA levels relative to a control group (either WT male or female, depending on the sex predominance of the gene) as measured by qRT-PCR are shown by the open bars. The open circles indicate the 3 biological replicates from the corresponding microarray results. A–C, Three “typical” genes were unaffected in Sst-KO females but feminized in Sst-KO males. D–F, Three “atypical” genes showed changes in both sexes of Sst-KO mice. RT-qPCR values shown are the mean + SEM (n = 5–11) and were analyzed by unpaired Student's t test; *, P < .05; **, P < .01; ***, P < .001. Statistical analyses of the microarray results are presented in Supplemental Table 2.

