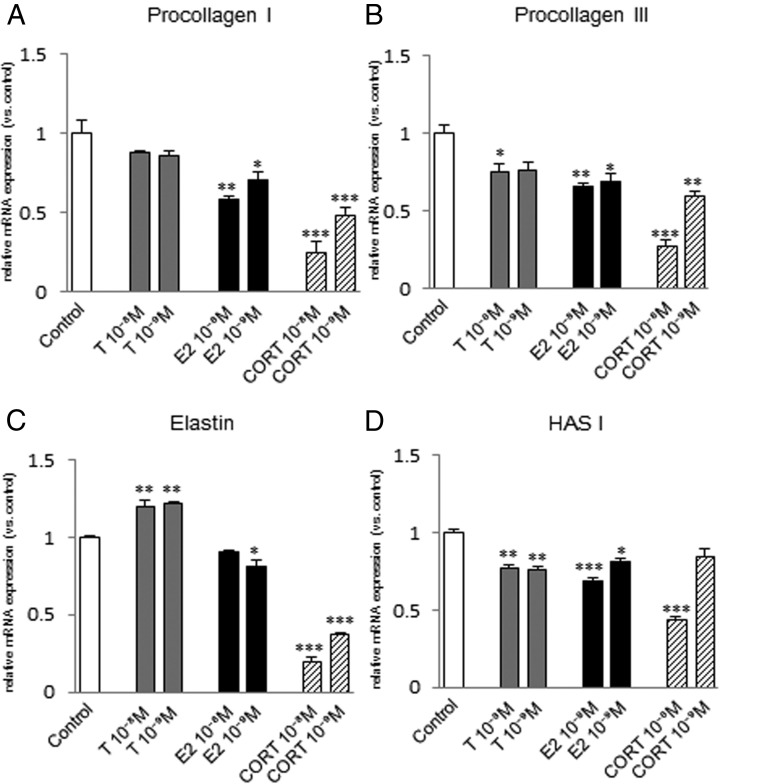
Figure 7.
Quantitative expression levels of ECM genes in fibroblasts from the esophagus after steroid hormone administration. mRNA levels for procollagen I (A), procollagen III (B), elastin (C), and HAS I (D) were examined by quantitative real-time PCR 48 hours after testosterone (T), estradiol (E2), or corticosterone (CORT) administration at 10−8 or 10−9 M. mRNA levels for ECM components were normalized to those of the control in each trial. Values are expressed as means ± SEM. *, P < .05 vs control; **, P < .01 vs control; ***, P < .001 vs control.

