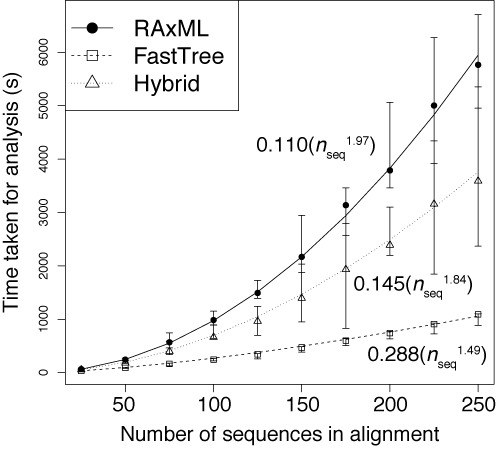
Figure 3.

Relationship between Gubbins analysis times and number of sequences in alignment (nseq). The time taken for the analysis of alignments containing different numbers of simulated sequences are shown when using RAxML for constructing the phylogeny at each iteration (solid line), using FastTree 2 for constructing the phylogeny at each iteration (dashed line), or a hybrid approach that uses FastTree 2 in the first iteration and RAxML for all subsequent iterations (dotted line). The formulae for each of the best fit trend lines are displayed.
