
Figure 4.
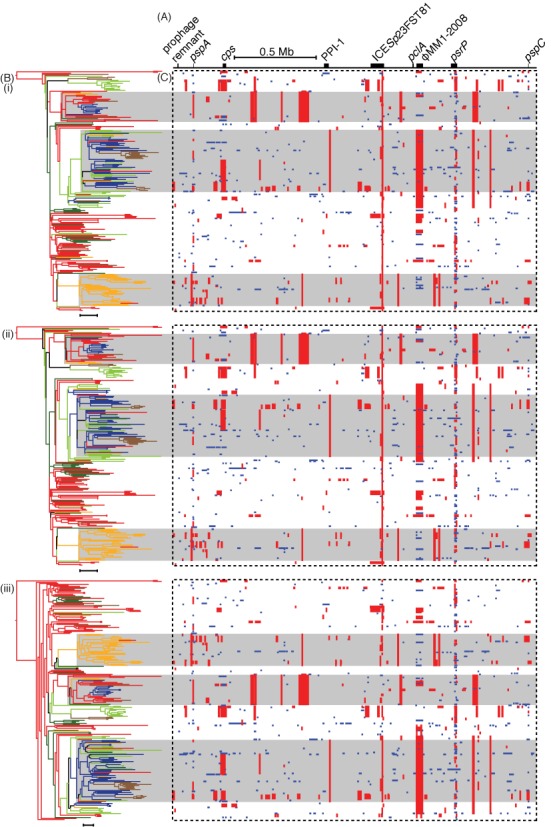
Analysis of the PMEN1 genome alignment with Gubbins employing different phylogeny construction strategies. (A) The simplified annotation of the S. pneumoniae ATCC 700669 genome. (B) The maximum likelihood phylogenies generated from the whole genome alignment of 241 S. pneumoniae PMEN1 isolates after re-analysis using the Gubbins algorithm either relying on (i) RAxML for constructing the phylogeny in each iteration, (ii) the hybrid approach of FastTree 2 for the first iteration and RAxML for subsequent iterations, or (iii) FastTree 2 for constructing the phylogeny in each iteration. Each phylogeny was midpoint rooted and colored according to location, as reconstructed through the tree from the countries of isolation of the sequences using maximum parsimony: red for Western Europe, brown for Eastern Europe, light green for North America, dark green for South America, yellow for South Africa and dark blue for South-East Asia. The backgrounds of three large clades are shaded gray to aid the alignment of the phylogeny with the panels in (C) (i–iii). Scale bars underneath the phylogenies represent a phylogenetic distance of 20 point mutations. (C) These panels represent the pattern of predicted recombinations from the analyses using the three different phylogeny estimation approaches (i–iii). Each column relates to a base in the reference genome; each row represents an isolate in the phylogeny. Red blocks indicate predicted recombinations occurring on an internal branch, which are therefore shared by multiple isolates through common descent. Blue blocks represent recombinations that occur on terminal branches, which are unique to individual isolates.