
Figure 2.
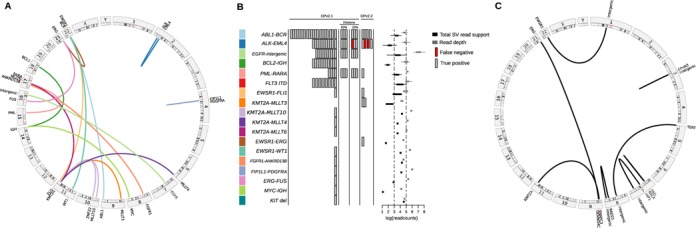
(A) A circos plot displaying links between gene partners and their genomic locations for the known translocations. (B) BreaKmer analysis results for the 38 cancer specimens and 80 ‘normal’ controls. For the 18 known SV events listed in the table rows, the true-positive (gray rectangle) and false-negative (red rectangle) results are shown for each replicate analyzed with the corresponding SV. The rectangles in the center are spaced to indicate separate samples. Boxplots on the right show the distributions of total read support (black boxplots) with the read depth (gray boxplots) at the inferred breakpoints for each of the known variants detected by BreaKmer. (C) A circos plot showing the validated novel translocation partners and their genomic locations identified by BreaKmer.